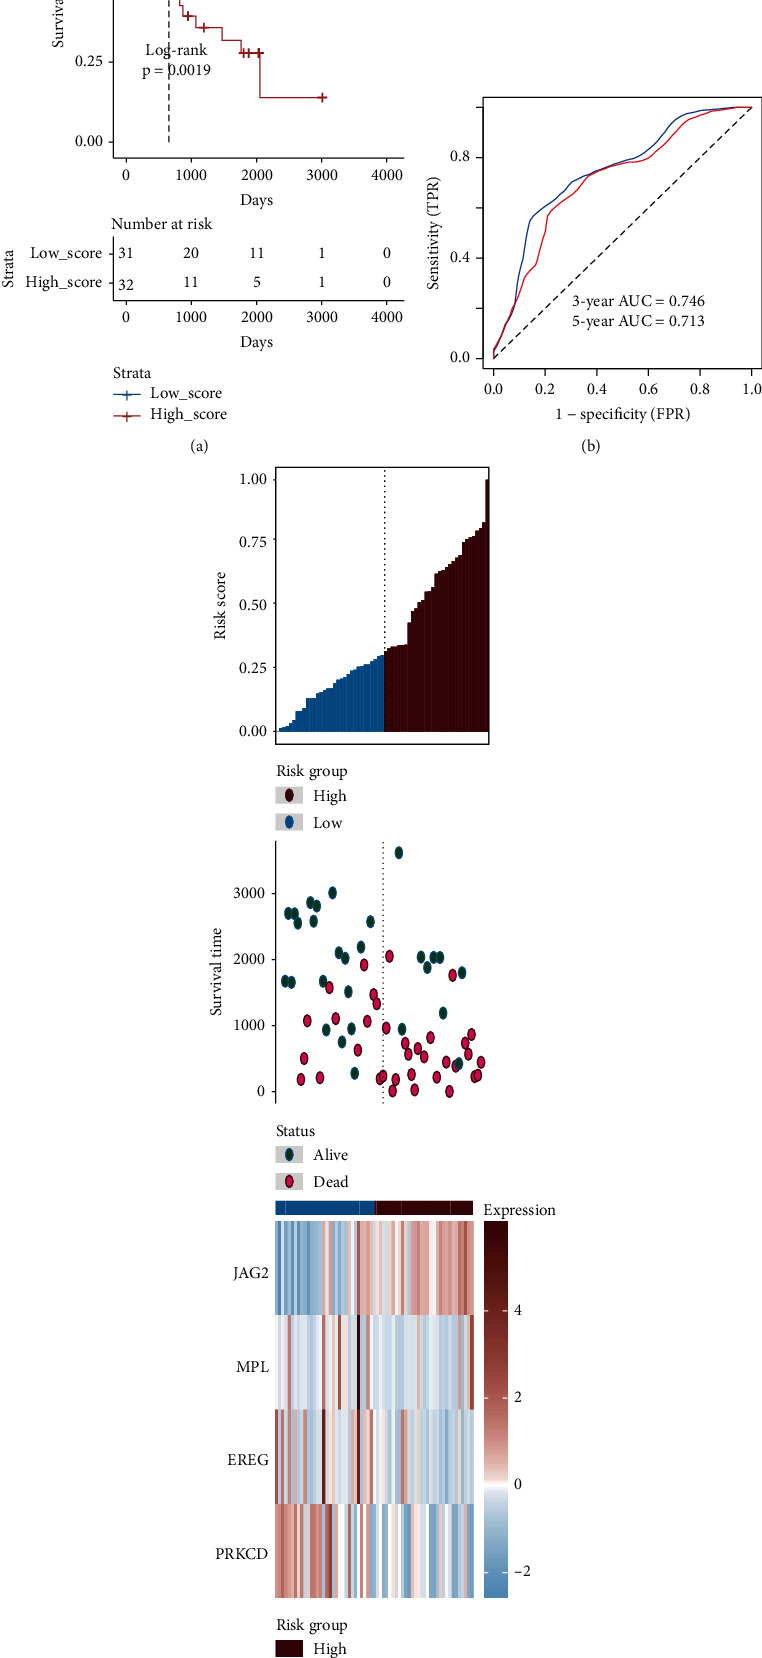
Figure 4.

Verification of the 4 genes of signature in the GSE22138. (a) The Kaplan-Meier analysis of the high- and low-risk groups in the GSE22138 dataset. (b) Receiver operating characteristic (ROC) analysis with area under the curve (AUC) for 4 genes of signature in 3 and 5 years. (c) The risk scores distribution, metastasis-free survival, vital status, and the expression value of 4 genes for the 63 UM patients in the GSE22138. From left to right, the bars display risk scores ranked in ascending order.
