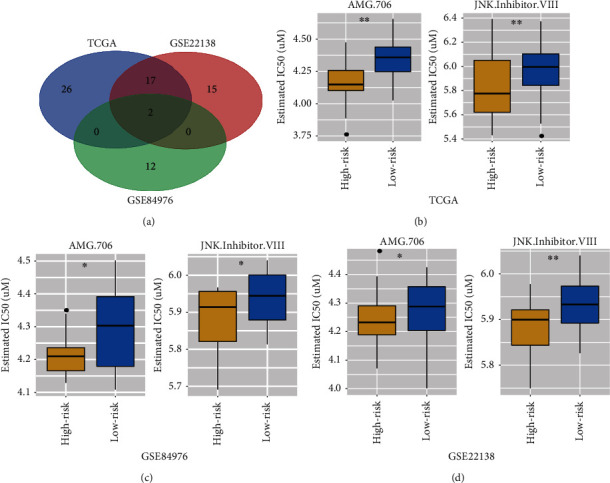
Figure 9.

Differential response of drugs. (a) The Venn plot of the three datasets including TCGA-UVM, GSE84976, and GSE22138. 19 kinds of compounds are shared in the TCGA-UVM and GSE22138. Only 2 kinds of compounds (AMG.706 and JNK.Inhibitor.VIII) are shared in the TCGA-UVM, GSE84976, and GSE22138. (b) The box plots for the estimation of IC50 in the AMG.706 and JNK.Inhibitor.VIII at the TCGA-UVM. (c) The box plots for the estimation of IC50 in the AMG.706 and JNK.Inhibitor.VIII at the GSE84976. (d) The box plots for the estimation of IC50 in the AMG.706 and JNK.Inhibitor.VIII at the GSE22138. ∗ means p < 0.05 and ∗∗ means p < 0.01.
