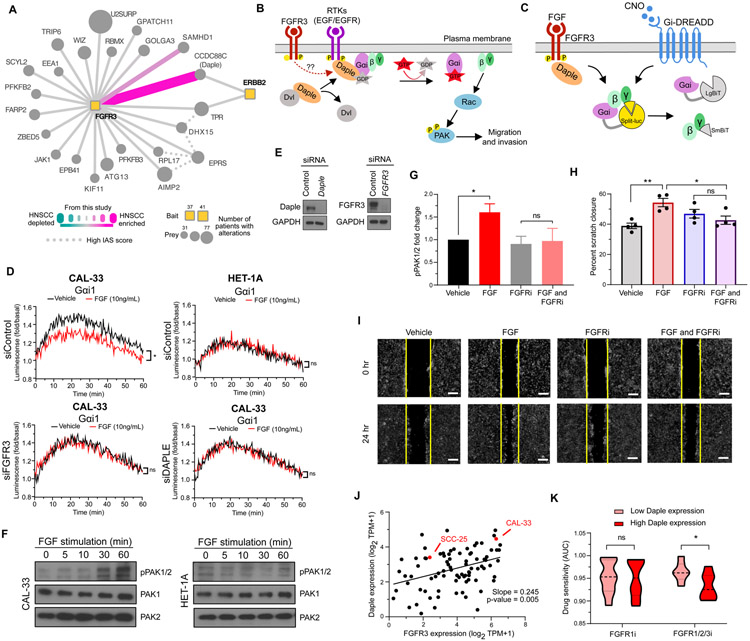
Figure 3. An HNSCC-enriched FGFR3:Daple interaction mediates activation of cell migratory proteins.
(A) Differential scoring analysis of the FGFR3 interactome highlights CCDC88C (Daple) as an HNSCC-enriched interaction partner to both FGFR3 and ERBB2 (HER2). (B) Activation of RTKs can disrupt the interaction between Disheveled (Dvl) and Daple, allowing Daple to function as a GEF for Gαi. GTP binding causes dissociation of the G protein, leaving Gβγ subunits free to activate migratory signaling through Rac and PAK. (C) NanoBiT biosensor measures Gαi activation through dissociation of the luciferase split between Gα and Gβγ. CNO mediates canonical GPCR signaling through the synthetic Gαi-coupled DREADD receptor. FGF mediates HNSCC-specific signaling through FGFR3 and Daple. (D) Luminescence was measured in CAL-33 and HET-1A cells transfected with Gαi NanoBiT and siRNA (control, FGFR3, or Daple) and stimulated with FGF (10ng/mL) (*P < 0.05 when compared with the vehicle-treated group). (E) Immunoblot analysis of CAL-33 subject to siRNA knockdown. (F) PAK1/2 autophosphorylation measured by immunoblot analysis over a time course of FGF stimulation (0, 5, 10, 30, 60 minutes) in CAL-33 and HET-1A cells. (G) PAK1/2 autophosphorylation measured by immunoblot analysis in CAL-33 cells stimulated with FGF (10ng/mL) and/or treated with 0.5μM of the pan FGFR inhibitor Infigratinib (*P < 0.05 when compared with the vehicle-treated group). (H-I) A vertical scratch was introduced to fibronectin-plated CAL-33 cells and cells were stimulated with FGF (10ng/mL) and/or treated with 0.5μM of Infigratinib. Replicate scratch closures were quantified (H, (*P < 0.05, **P < 0.01 when compared with the vehicle-treated group)), and (I) images were taken at 0 and 24 hours after FGF stimulation (scale bar = 250μm). (J) Daple and FGFR3 expression are plotted for all upper airway and esophageal cell lines in DepMap (62), with the two cancer cell lines used in this study highlighted in red. (K) The sensitivity of cell lines with high or low Daple expression to either a FGFR1 inhibitor (sorafinib), or a FGFR1/2/3 inhibitor (AZD4547) as quantified by area under the curve (AUC) (*P < 0.05). Cell lines were selected from panel J, and for those with corresponding drug sensitivity data the top 5 Daple expressing cells (High Daple) or the bottom 5 Daple expressing cells (Low Daple), were used.

