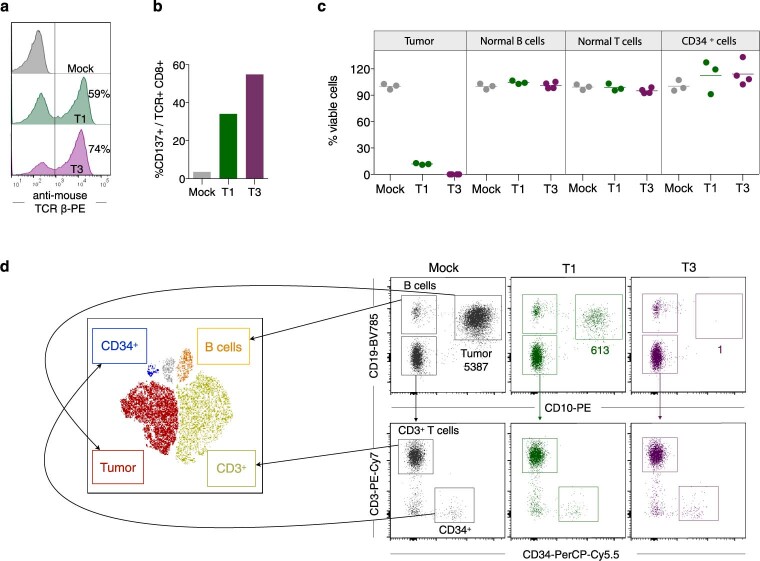
Extended Data Fig. 8. Patient-derived CD8+ T cells transduced with T1 or T3 efficiently kill autologous B-ALL cells.
(a) Transduction efficiency of the T1 (green) and T3 (purple) TCRs in normal CD8+ T cells from an HLA-A2pos TdTpos patient diagnosed with B-ALL. Histograms are gated on live, CD8+ T cells. (b) T1 and T3 cell activation after 18 h co-culture with the autologous blasts. (c) Quantification of malignant cells, normal B, T and CD34+lin− progenitor cells after performing the flow cytometry-based cytotoxicity assay for 72 h. Data points represents technical replicates (3-4) from one representative experiment out of 2 performed and horizontal lines show mean. (d) Flow cytometry dot plots from one of the test replicates in c, showing gating strategy to identify tumor blasts (CD19+CD10+), normal B cells (CD19+CD10−), T cells (CD19−CD10−CD3+) and CD34+ progenitor cells (CD19−CD10−CD3−CD34+). Populations were gated and overlaid on a t-SNE plot with designated colors as indicated (left view). Inset numbers in d show event count of tumor cells after co-culture with mock, T1 and T3 cells.

