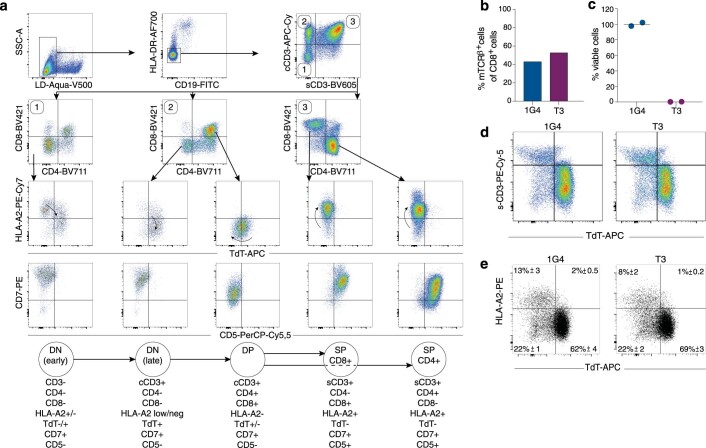
Extended Data Fig. 9. Expression of TdT and HLA-A2 during T cell development.
(a) Flow cytometric analysis of thymocytes from normal human thymus removed from a four months old child with congenital cardiac defect (but otherwise healthy) in conjunction with cardiac surgery. Flow plots show gating strategy to define four key developmental stages during thymocyte differentiation, including 1) early double negative (DN), 2) late double negative, 3) double positive (DP) and 4) single positive (SP, either CD4+ or CD8+) thymocytes. Arrows within the FACS plots in third row indicate direction of differentiation with regard to expression of TdT and HLA-A2 during these developmental stages, illustrated with continuous lines in Fig. 6b. (b) Percentage of TCR-transduced cells among CD8+ T cells isolated from spleens of three humanized NSG mice engrafted with healthy cord blood following transduction and expansion, prior to infusion into littermates day 0, as illustrated in Fig. 6c. (c) Functionality of human TCR-transduced T cells shown in (b), as determined by the number of viable BV173 cells present after 72 h co-culture, in percent of corresponding numbers following treatment with 1G4 cells, quantified by flow cytometry (E/T ratio of 1/1). Co-cultures were started on the same day as T cells were injected into mice. Data points show 2 technical replicates from one experiment. (d,e) Representative FACS plots of viable single hCD45+CD19−CD33− thymocytes from 1G4 or T3-treated humanized NSG mice at terminal analysis on day 17 post T cell infusion illustrating surface CD3 and TdT expression (d) and HLA-A2 and TdT expression (e). Inset numbers show mean ± s.e.m., n = 8 per group.

