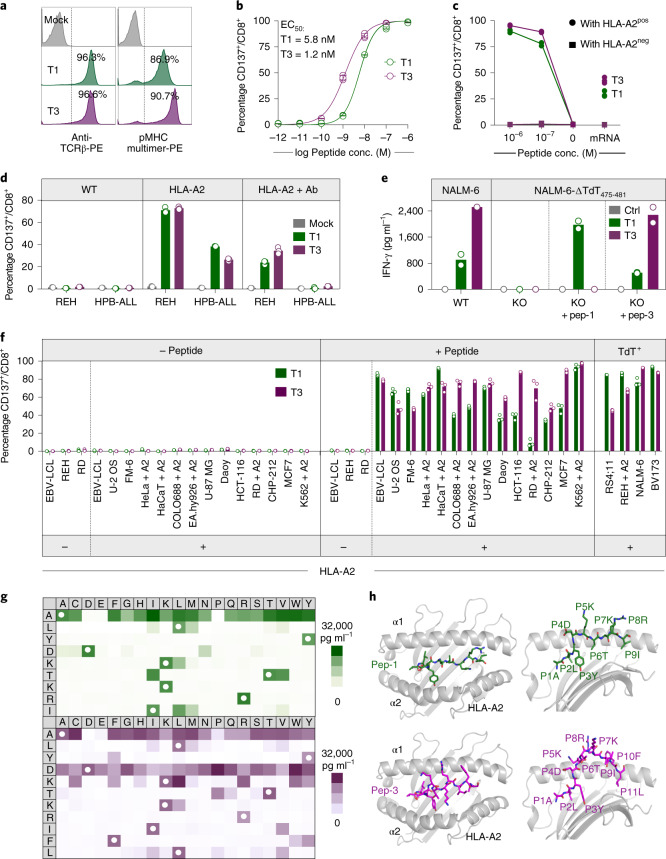
Fig. 2. T1 and T3 are specific for TdT and HLA-A2 and do not show off-target reactivity.
a, Histograms of viable CD8+ T cells transduced with T1 and T3 TCRs stained with anti-mouse TCR-β antibody or relevant peptide–MHC multimers. b, Activation of T1 and T3 cells following coincubation with peptide-pulsed T2 lymphoblast cells. Data are pooled from three independent experiments, with each circle representing the mean of three technical replicates in each experiment. Data are shown as mean ± s.d. c, CD137 upregulation on CD8+ T1 (green) and T3 (purple) cells after coculture with EBV-LCLs derived from one HLA-A2pos and one HLA-A2neg donor, either pulsed with relevant peptides or electroporated with mRNA encoding full-length TdT. d, Activation of CD8+ T1 and T3 cells after coculture with TdTpos cell lines REH (B-ALL) and HPB-ALL (T-ALL) in the presence/absence of introduced expression of HLA-A2, or pan-MHC class I blocking antibody W6/32 (Ab). e, IFN-γ production by T1 and T3 cells following coincubation with TdTpos NALM-6 cells (WT), or NALM-6 cells in which TdT475-481 was deleted by CRISPR–Cas9 (KO) in the presence/absence of added peptide. f, Activation of T1 and T3 cells after coculture with various cell lines, with indicated HLA-A2 and TdT expression, loaded or not with TdT peptides (2 × 10⁻⁷ M). The suffix + A2 denotes cell lines transduced with HLA-A*02:01. c–f, Results are from one experiment representative of two or three performed with different T-cell donors. Bars or connecting lines show mean, and individual data points represent either two (e) or three (c,d,f) technical replicates. g, Heat maps of IFN-γ produced by T1 (green) and T3 cells (purple) coincubated with EBV-LCLs pulsed with peptides from mimotope libraries. White circles, amino acid in wild-type peptide. IFN-γ concentration range for positive reactions was 500–31,254 pg ml–1. One replicate per condition (see Extended Data Fig. 2c for correlation with CD137 activation assay). h, Model structures of TdT peptide-1 (green) and -3 (purple) represented as sticks, bound to the HLA-A2 molecule, in gray, shown from top (left) and side views (right). Individual amino acids are labeled with positional number and symbol.

