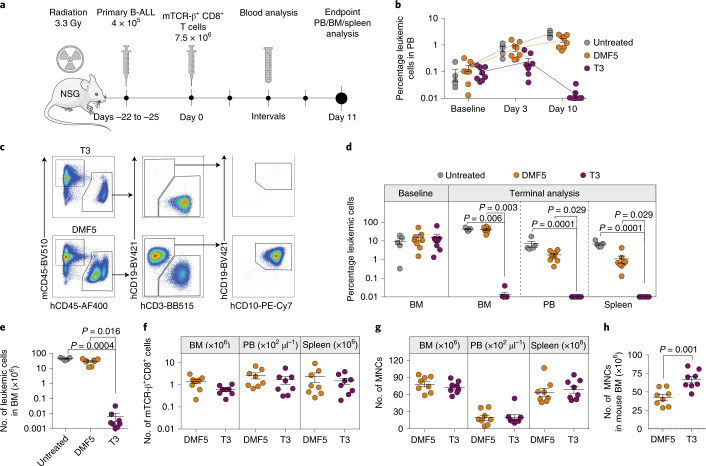
Fig. 5. T3 cells efficiently eliminate primary B-ALL cells in vivo.
a, Experimental overview of the PDX model. b, Percentage leukemic cells adjusted for human T cells in PB at baseline and at indicated time points after T-cell infusion. c, Representative FACS plots of viable single MNCs from BM of T3-treated (top) and DMF5-treated (bottom) NSG mice engrafted with primary human B-ALL cells. d, Percentage leukemic cells (hCD45+CD19+CD10+) adjusted for human T cells at baseline (BM) and at terminal analysis on day 11 after T-cell infusion (BM, PB and spleen). e, Number of leukemic cells present in BM. f, Number of TCR-transduced human CD8+ cells in BM, PB and spleen. g, Total numbers of human- and mouse-derived MNCs in BM, PB and spleen. h, Number of mouse CD45+ cells in BM. b,d–h, Data are pooled from two independent experiments and presented as mean ± s.e.m. of untreated (n = 5), DMF5-treated (n = 8) and T3-treated (n = 8) mice. Populations identified by flow cytometry according to gating strategy shown in c. Kruskal–Wallis one-way ANOVA by Dunn’s multiple comparisons test (d,e) and two-tailed Mann–Whitney test (f–h) were performed for statistical analyses.

