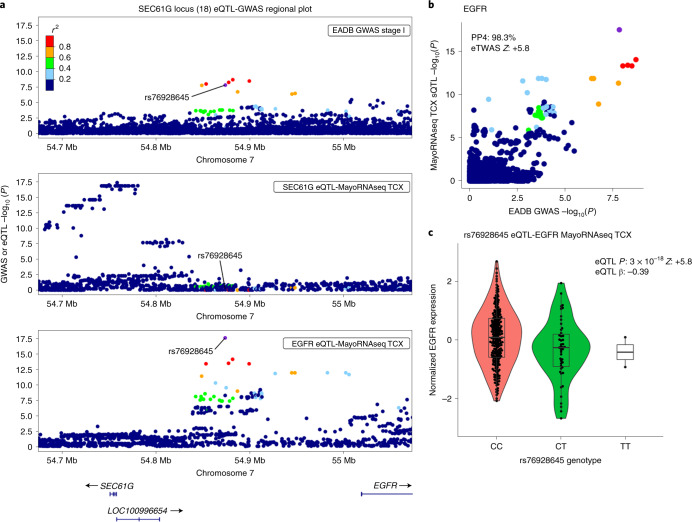
Fig. 3. Regulation of EGFR expression by the ADD-risk-associated and colocalized brain eQTLs within the intergenic SEC61G locus.
a, The regional plot of the new SEC61G locus (L18) shows the EADB GWAS stage I (n = 487,511) ADD association signal within 200 kb of the intergenic lead variant, rs76928645 (the two closest protein-coding genes, SEC61G and EGFR, are more than 100 kb from the lead variant), together with the eQTLs in the same region identified for SEC61G and EGFR expression separately in the TCX (MayoRNAseq TCX eQTL catalog based on n = 259 individuals). The rs7692864 lead variant is shown in purple, and LD r2 values (calculated for the EADB Trans-Omics for Precision Medicine (TOPMed) dataset (n = 42,140) with respect to the lead variant) are indicated on a color scale. y axis, −log10 for the GWAS or eQTL P value; x axis, hg38 genomic position on chromosome 7. b, Colocalization between the EGFR eQTL signal (MayoRNAseq TCX, n = 259 individuals) and the EADB GWAS stage I (n = 487,511) signal (eQTL coloc PP4 = 98.3%); with the significant eTWAS association (eTWAS P = 6.9 × 10⁻⁹ and eTWAS Z = 5.8) and fine-mapped (FOCUS PIP = 1) eTWAS association in the same catalog. y axis, eQTL −log10(P) value; x axis, GWAS −log10(P) value. LD r2 values and color scales are as in a. c, The eQTL violin plot shows a significant association (eQTL P = 3 × 10⁻¹⁸) between the rs76928645 lead variant genotype and EGFR expression in the TCX (MayoRNAseq TCX, n = 259 individuals), where the protective allele T is associated with lower EGFR expression (eQTL β, −0.39). Each data point represents a sample whose normalized EGFR expression value is indicated on the y axis, and the rs76928645 genotype information is indicated on the x axis. The lower and upper hinges of the boxes represent the first and third quantiles, the whiskers extend 1.5 times the interquartile range from the hinges and the line represents the median.

