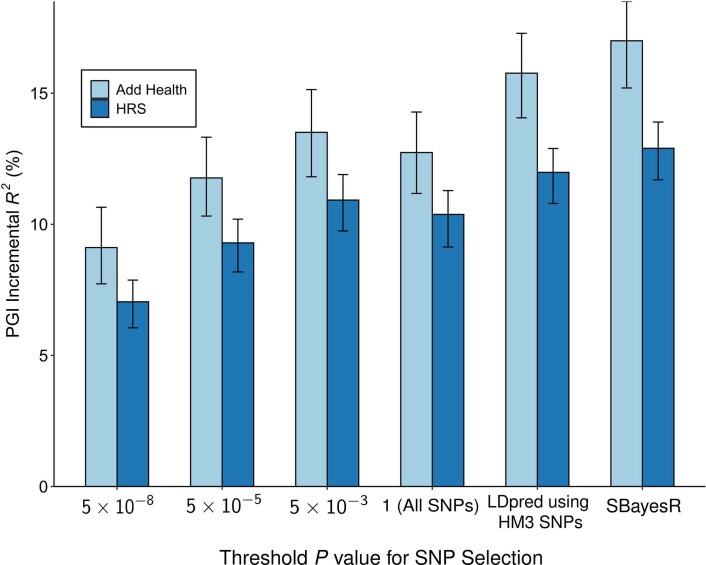
Extended Data Fig. 5. Predictive power of the EduYears PGI as a function of pruning at different P value thresholds.
Each bar represents the incremental with error bars showing the 95% confidence intervals bootstrapped with 1,000 iterations each. Each clumping and thresholding PGI is based on a set of approximately independent SNPs identified using the clumping algorithm defined in Supplementary Note section 2.2.6. For HRS (N = 10,843 individuals) and Add Health (N = 5,653 individuals) respectively, the number of SNPs included in the PGI is (with P value threshold in parentheses): 3,806 and 3,843 (5 × 10⁻⁸); 10,852 and 10,897 (5 × 10⁻⁵); 33,159 and 32,693 (5 × 10⁻³); 281,087 and 247,329 (1); 1,137,480 and 1,170,675 (All HapMap3 SNPs, LDpred); 2,540,570 and 2,548,339 (SBayesR). P-values are based on two-sided Z-tests. Incremental is the difference between the from a regression of EduYears on the PGI and the controls (sex, birth-year dummies, their interactions, and 10 PCs) and the from a regression of EduYears on just the controls.

