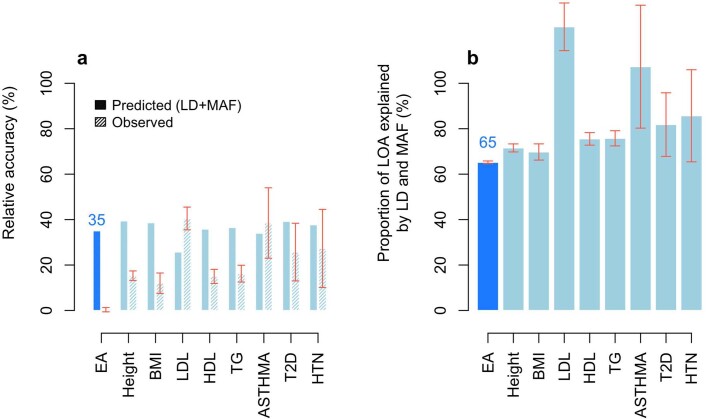
Extended Data Fig. 8. European genetic ancestries to African genetic ancestries relative accuracy.
Panel (a) plots the relative accuracy (RA) with error bars representing confidence intervals with + /− 1 standard error. Panel (b) plots the proportion of the loss of accuracy (LOA) explained by LD and MAF calculated as 100% × (1 − RApred(LD+MAF))/(1 − RAobs) with error bars representing confidence intervals with + /− 1 standard error. RA refers to the European genetic ancestries to African genetic ancestries ratio of prediction accuracies (R2) of PGIs trained in a large sample of European-genetic-ancestry UKB participants (N = 425,231). The accuracy in European-genetic-ancestry participants was assessed in a holdout sample of 10,000 unrelated individuals, while the accuracy in African-genetic-ancestry participants was assessed in a holdout sample of 6,514 unrelated individuals. Phenotype labels: EA (Educational Attainment), Height (standing height), BMI (body mass index), LDL (low-density lipoprotein cholesterol), HDL (high-density lipoprotein cholesterol), TG (triglycerides), ASTHMA (diagnosed asthma), T2D (diagnosed type 2 diabetes) and HTN (diagnosed hypertension). See Supplementary Note section 7 in Wang et al. for additional details. Data underlying this Figure are reported in Supplementary Table 5.

