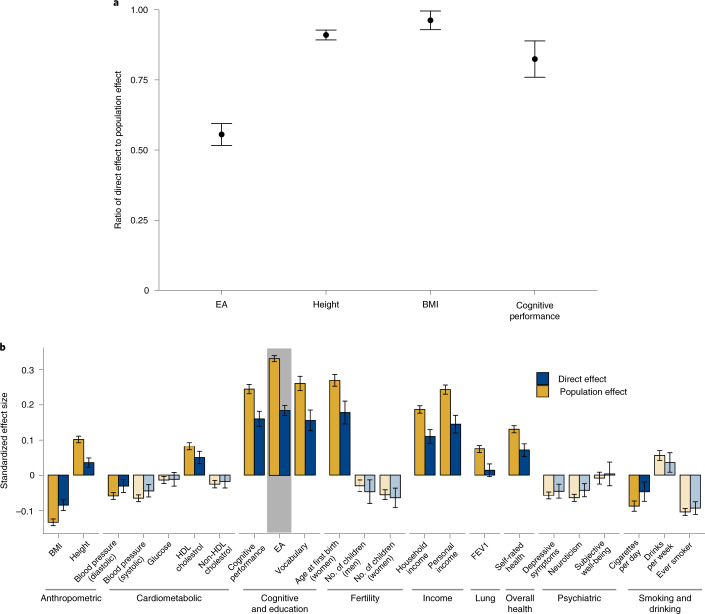
Fig. 4. Meta-analysis estimates of direct and population effects of PGIs.
a, For each PGI, the ratio of the direct effect to the population effect on the phenotype from which the PGI was derived. b, The effects of the EA PGI on 23 phenotypes. Bars are shaded lighter when the population and direct effects are statistically indistinguishable (two-sided Z test P > 0.05/23, where 23 is the number of phenotypes under study). For both panels, estimates are from meta-analyses of UKB, GS, and STR samples of siblings and trios. Phenotypes and the PGIs are scaled to have variance one, so effects correspond to partial correlation coefficients. Error bars represent 95% CIs. See Supplementary Table 9 for details on phenotypes and Supplementary Tables 10–13 for numerical values underlying this figure. FEV1, forced expiratory volume during the first second; HDL, high-density lipoprotein.

