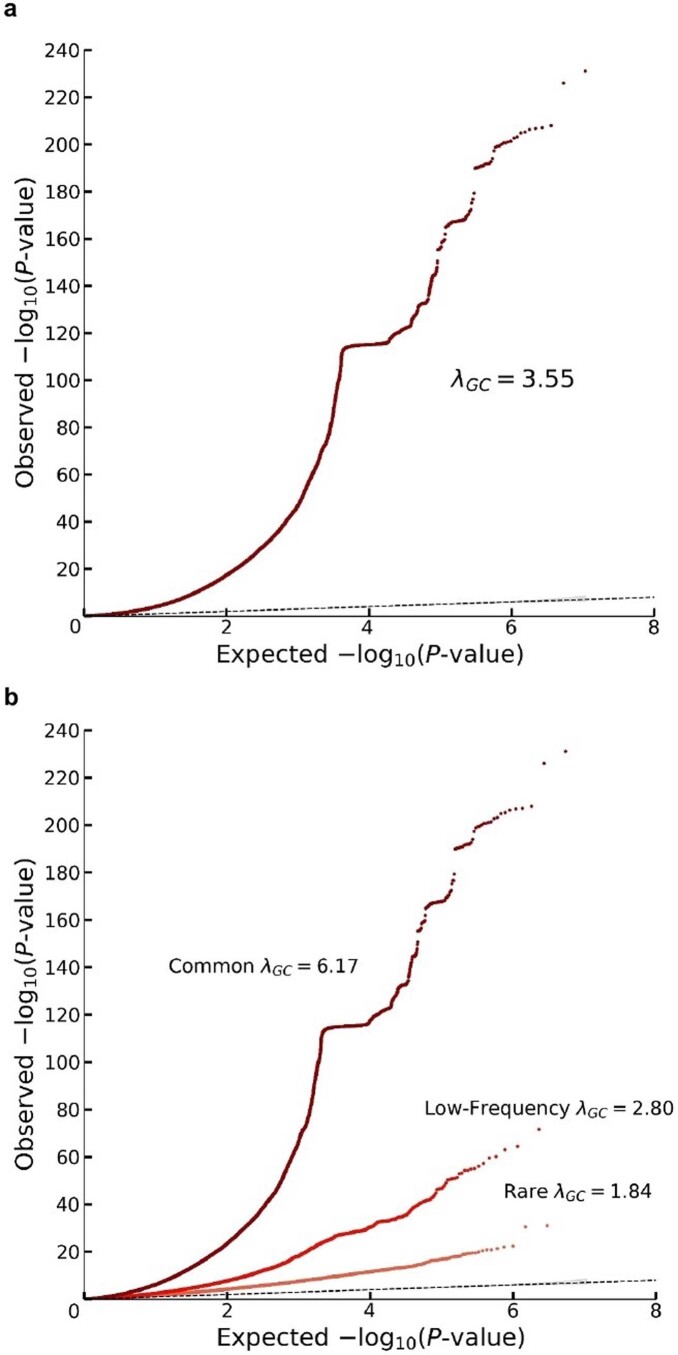
Extended Data Fig. 1. Quantile-quantile plots for the additive GWAS meta-analysis.
The panels display Q-Q plots, which show the -log10(P-values) based on a two-sided Z-tests for (a) all SNPs and (b) SNPs grouped by minor allele frequency (MAF): rare (<1%), low frequency (1–5%) and common (>5%). The plots and numbers are based on the unadjusted GWAS summary statistics (that is with standard errors that were not inflated by the square root of the estimated LD Score intercept). The dotted line represents the expected -log10(P-values) under the null hypothesis. The (barely visible) gray shaded areas in the Q-Q plots represent the 95% confidence intervals under the null hypothesis. The flat horizontal region in the plots is an inversion region in chromosome 17 (17q21.31).

