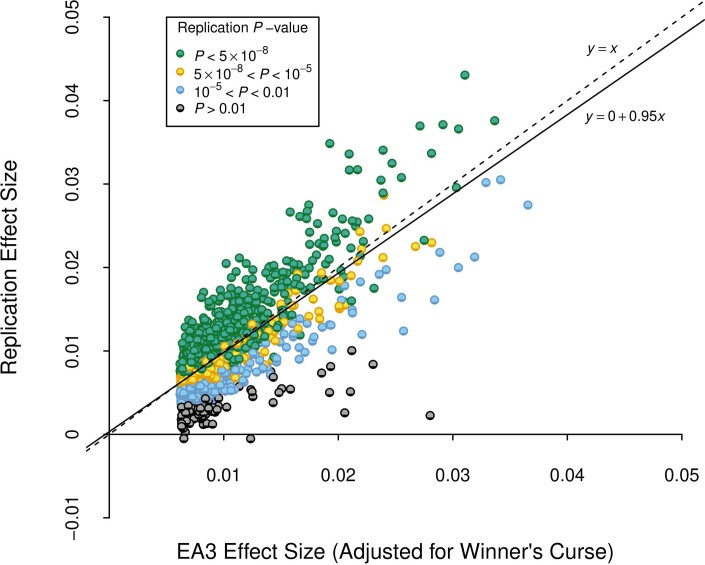
Extended Data Fig. 3. Replication of EA3 lead SNPs.
We examined the out-of-sample replicability of the 1,504 lead SNPs identified at genome-wide significance in a version of our previously published GWAS meta-analysis of EduYears (EA3), with the UKB GWAS in that analysis replaced by a UKB GWAS that uses the new phenotype coding explained in Supplementary Note section 1.1. Prior to clumping, we dropped SNPs that had a sample size smaller than 80% of the maximum sample size in the updated EA3 data (NEA3,max = 1,130,819), or that had a sample size in the new data smaller than 80% of the maximum sample size of the new data (Nnew,max = 2,272,216). The x axis is the winner’s-curse-adjusted estimate of the SNP’s effect size in the updated EA3 study (calculated using shrinkage parameters estimated using summary statistics from EA3). The y axis is the SNP’s effect size estimated from the subsample of our data that did not contribute to the EA3 GWAS. All effect sizes are from a regression where the phenotype has been standardized to have unit variance. The reference allele is chosen to be the allele estimated to increase EA in EA3. The dashed line is the identity, and the solid line is the fitted regression line. P-values are based on two-sided Z-tests.

