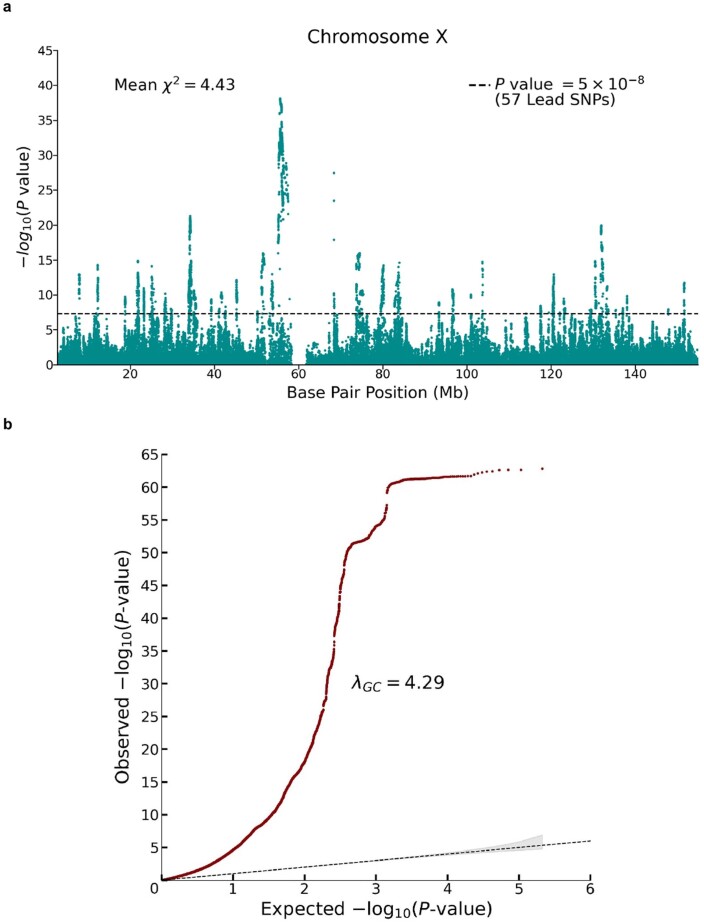
Extended Data Fig. 4. Meta-analysis of X chromosome SNPs (N = 2,713,033 individuals).
The meta-analysis was conducted by combining summary statistics from (pooled-sex) association analyses conducted in UK Biobank (N = 440,817 individuals) and 23andMe (N = 2,272,216 individuals); see Supplementary Note section 3.4 for details. Panel (a): Manhattan plot, in which P values are based on summary statistics adjusted for inflation using the LD score intercept estimated from an autosomal association analysis of UKB and 23andMe. The solid line indicates the threshold for genome-wide significance (P = 5 × 10⁻⁸ based on a two-sided Z-test adjusted for multiple comparisons). Panel (b): Q-Q plot, in which P values are based on unadjusted Z-test statistics. The dotted line represents the expected -log10(P-values) under the null hypothesis. The (barely visible) gray shaded area in represents the 95% confidence intervals under the null hypothesis.

