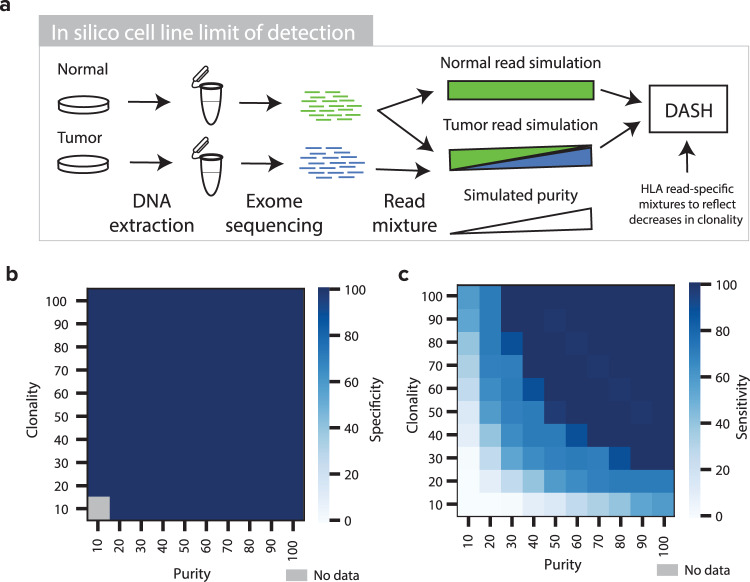
Fig. 2. In silico cell line mixtures to determine DASH limit of detection.
a A schematic showing the tumor and normal cell line mixing approach for simulating low-purity sample pairs. b and c Heatmaps showing the b specificity and c sensitivity of DASH to capture HLA LOH in simulated samples of differing purity and clonality. Dark blue denotes high sensitivity or specificity, light blue denotes low sensitivity or specificity and gray denotes no data. Source data are provided with this paper.

