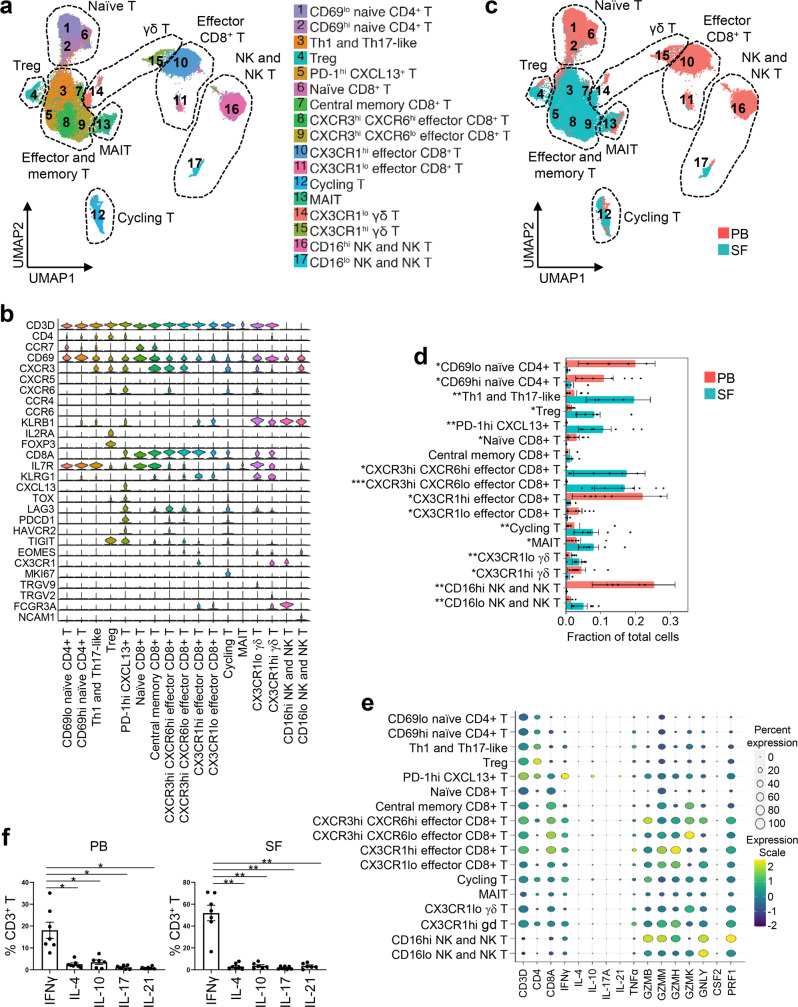
Fig. 2. Interferon gamma (IFNγ)-producing Th1/Tc1 cells might play a role in arthritis as an immune-related adverse event, according to subcluster analysis of T, natural killer (NK), and NK T cells.
a Identification of 17 subclusters of NK, NK T, and T cell populations across all samples and annotation of the subclusters. Treg, regulatory T cells; MAIT, mucosal-associated invariant T cells. b Gene expression of canonical markers across subclusters. See Supplementary Data 3 for all differentially expressed genes. c Identification of subclusters distinctly present in PB or SF. d Quantification of the subclusters and comparison of the cellular fraction of each cluster between PB and SF samples. n = 8 PB and matching SF samples. Two-sided unpaired t test. CD69lo naïve CD4+ T cells, *P = 0.011; CD69hi naïve CD4+ T cells, *P = 0.016; Th1 and Th17-like, **P = 0.009; Treg, *P = 0.011; PD-1hi CXCL13+ T cells, **P = 0.003; Naïve CD8+ T cells, *P = 0.010; CXCR3hi CXCR6hi effector CD8+ T cells, *P = 0.014; CXCR3hi CXCR6lo effector CD8+ T cells, ***P = 0.0008; CX3CR1hi effector CD8+ T cells, *P = 0.021; CX3CR1lo effector CD8+ T cells, *P = 0.020; Cycling T, **P = 0.0012; MAIT, *P = 0.028; CX3CR1lo γδ T cells. **P = 0.005; CX3CR1hi γδ T cells, *P = 0.022; CD16hi NK/NK T cells, **P = 0.004; CD16lo NK/NK T cells, **P = 0.003. Bars indicate the mean and SEM. e Bubble plots showing expression levels and frequencies of key effector T cell cytokines and inflammatory molecules across subclusters. n = 8 PB and matching SF samples. f Flow cytometry analysis to quantify cytokine-producing T cells after stimulation with PMA and ionomycin for 4 h. n = 6 (PB IL-10; SF IL-10; SF IL-21) or n = 7 (PB IFNγ; PB IL-4; PB IL-17; PB IL-21; SF IFNγ; SF IL-4; SF IL-17). One-way analysis of variance. *P < 0.05, **P < 0.01. PB (left to right): *P = 0.0245, *P = 0.0267, *P = 0.0102, *P = 0.0125. SF (left to right): **P = 0.0011, **P = 0.0041, **P = 0.0013, **P = 0.0030. Bars indicate the mean and SEM. Source data are provided as a Source Data file.

