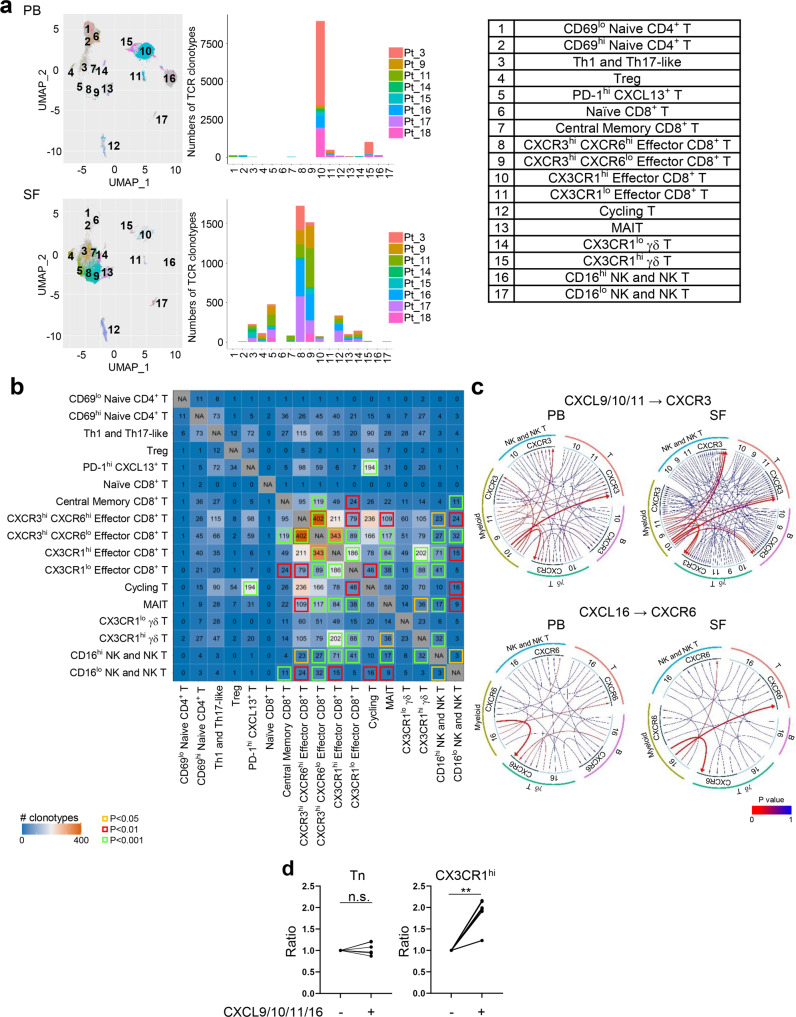
Fig. 4. CXCR3hi CXCR6hi/lo effector CD8+ T cells, recruited via CXCL9/10/11 and CXCL16 secreted by myeloid cells, may contribute pathogenesis of arthritis as an immune-related adverse event.
a UMAP view of the distribution of top 100 expanded T cell clones in natural killer (NK), NK T, and T cell clusters (left), number of top 100 expanded T cell clones across clusters from each patient (middle), and annotation of the 17 cell clusters (right). n = 8 PB and matching SF samples. PB, peripheral blood; SF, synovial fluid; TCR, T cell receptor; Treg, regulatory T cells; MAIT, mucosal-associated invariant T cells. b Heatmap showing T cell repertoire overlap across clusters. Numbers indicate the number of shared clonotypes between each cluster pair. Statistically significant overlap of T cell clones is indicated by colored boxes, based on a one-sided Fisher’s Exact test followed by adjusting the false discovery rate using the Benjamini-Hochberg method. n = 8 PB and matching SF samples. c Circos plots showing interactions between major immune cells subsets via chemokine receptors (CXCR3 and CXCR6) and their ligands (CXCL9/10/11 and CXCL16). The lines were colored based on their statistically significance and the weight of the lines denotes their corresponding gene expression levels, the higher the expression level, the thicker the line. n = 8 PB and matching SF samples. d Ratio of migrated cells in response to CXCL9/10/11/16 to migrated cells in the absence of the chemokines. n = 6 PB samples from arthritis-irAE patients. Tn: naïve CD8+ T cells; CX3CR1hi, CX3CR1hi effector CD8+ T cells. Two-sided paired t test. CX3CR1hi, **P = 0.0014. Source data are provided as a Source Data file.

