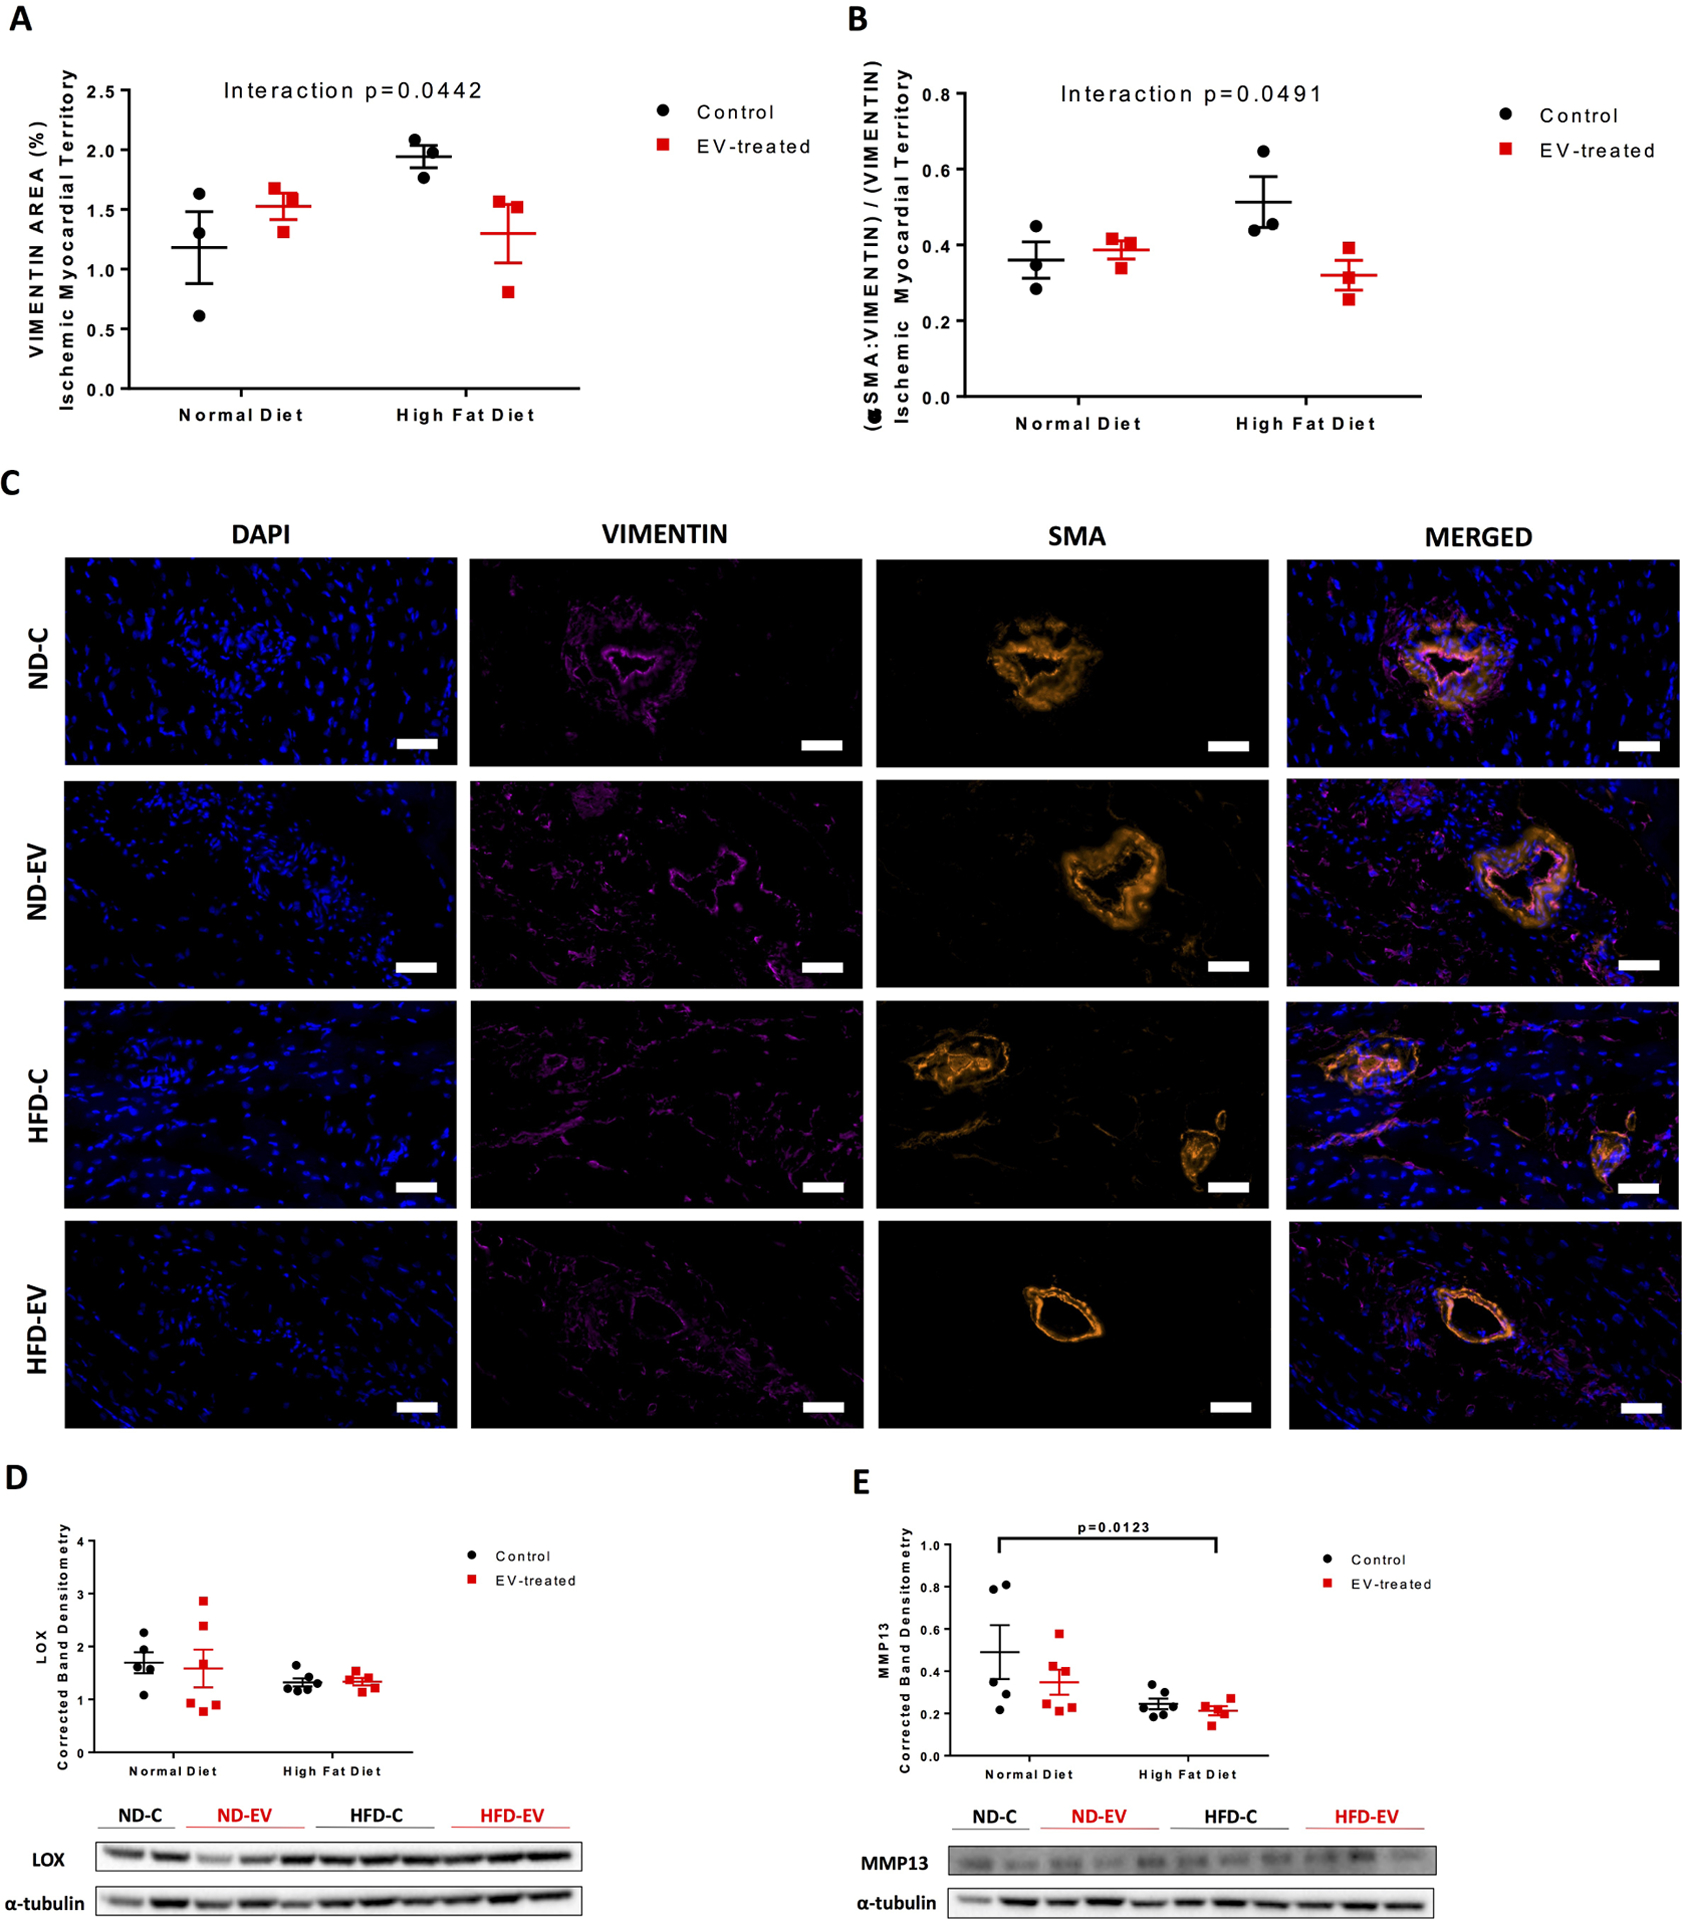
Figure 3: Interaction between EVs and Diet with Markers of Fibroblasts and Myofibroblasts.

Cardiac fibroblast and stem-cell marker (A) vimentin percent area was measured. The fraction of myofibroblasts was measured as the (B) fraction of αSMA and vimentin positive area over total vimentin area. Analysis was performed at 10x magnification with five areas per animal. Representative images are at 40x; scale bar 50 μm. (C) and (D) Western blots of protein lysates from porcine ischemic myocardial tissue were performed as indicated with quantitative analyses normalized to α-tubulin and representative images (D) LOX and (E) MMP13. Data is graphed as mean with SEM, with main effect of diet as large bracket and main effect of EVs as inner brackets. LOX, lysyl oxidase; MMP-13, matrix metalloproteinase 13. Scale bar 100 μm.
