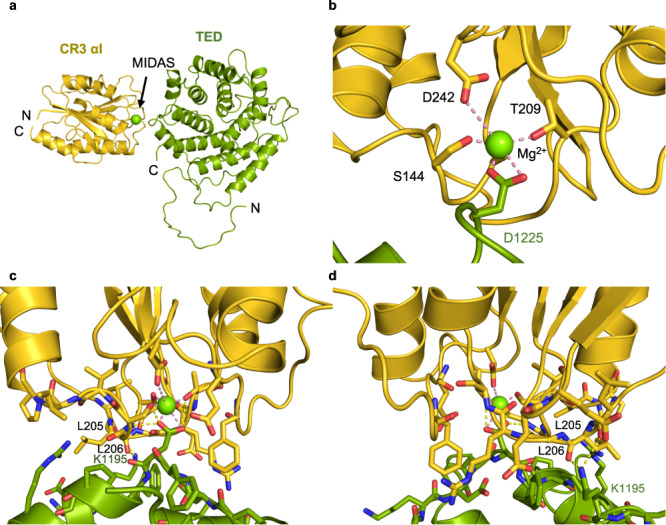
Fig. 2. Interface of the TED–CR3 αI subcomplex of iC3b–CR3 αI.

a Overall structure of the subcomplex. Cartoon representations of the TED domain and part of the CUBg segment are colored in splitpea and the αI domain of CR3 in gold. The Mg2+ cation of the MIDAS motif is shown as a green sphere. b Zoom into the Mg2+ coordination sphere. Distances between oxygen atoms and the Mg2+ ion are shown as wheat dashed lines. c, d Two side views into the TED-αI interface related by an almost 180° rotation around a vertical axis. In addition to the coordination bonds, interchain hydrogen bonds are shown as dashed lines (colored in yellow).
