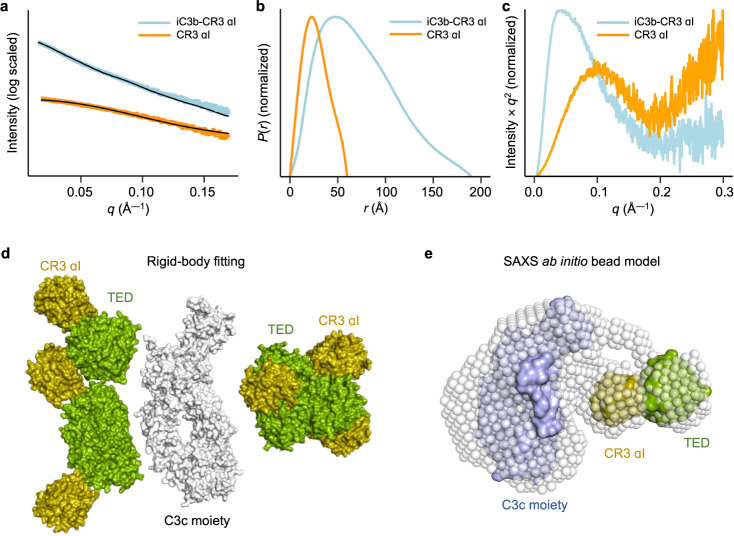
Fig. 6. SAXS shape restoration of the iC3b–CR3 αI complex.
a Experimental scattering curves for iC3b–CR3 αI (cyan), the same sample used for crystallization, and the αI domain (orange). b Pair distance distribution function P(r) plotted against distance (r). c Kratky plot showing that the iC3b–CR3 αI complex (cyan) is a compact, well-folded structure. In contrast, the structure of the constitutively opened mutant CR3 αI domain is less compact as the curve trends upward as the momentum transfer q increases. d Composite model showing the molecular surface for the C3c moiety of iC3b (in white) surrounded by the best-fitting (χ2 = 2.0–8.0) TED–CR3 αI domain subcomplexes (shown in molecular surface representation, the TED domain in green and the CR3 αI domain in olive). The labels indicate the position of the subunits in the TED–CR3 αI domain subcomplexes. e Representative bead model calculated for the iC3b–CR3 αI complex from the SAXS scattering data ab initio with DAMMIF/N. The crystallographic C3c moiety of iC3b (in light blue) and the TED–CR3 αI domain subcomplex (TED in green and the CR3 αI domain in olive) were fitted by rigid-body modeling. Source data are provided as a Source Data file.

