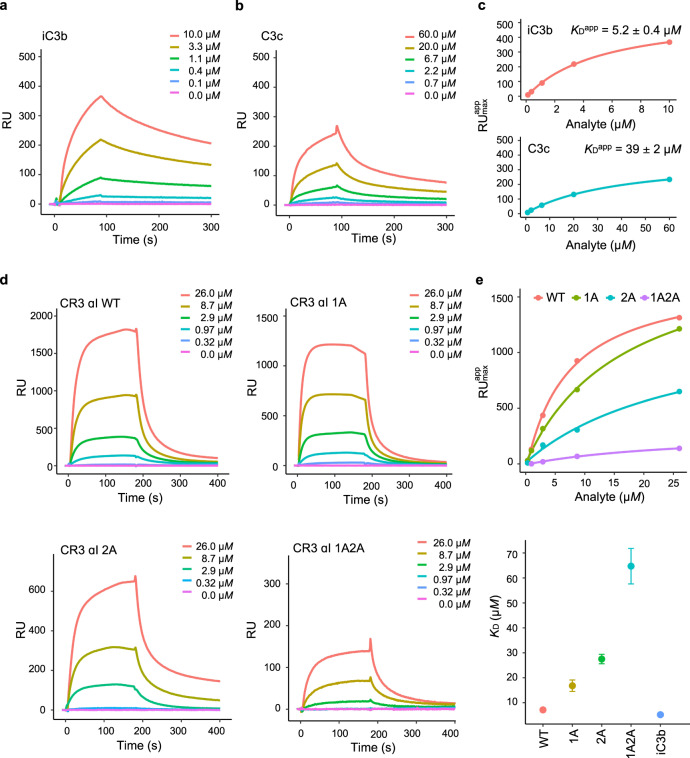
Fig. 7. SPR analysis of the interaction between the CR3 αI domain and C3c and iC3b.
a–c SPR experiments were performed with CR3 αI immobilized to the surface of a streptavidin (SA) Biacore sensor chip (Cytiva) through a 29-Å-long NHS-PEG4-Biotin spacer arm. a Sensorgram obtained with iC3b as the analyte (5 injections at 0.1–10.0 μM). b Sensorgram obtained with C3c as the analyte (5 injections at 0.7–60.0 μM). c Maximum RU value reached during each injection plotted vs. analyte concentration. The experimental data point is shown as a filled circle and the fitted line is shown in the same color. d–e SPR experiments were performed with iC3b immobilized to a CM5 sensor chip (Cytiva) via maleimide chemistry. d Sensorgrams obtained with the αI variants as analyte (5 injections at 0.32–26.0 μM). e Maximum RU value reached during each injection plotted vs. analyte concentration; the experimental data point is shown as a filled circle and the fitted line is shown in the same color (top). Plot of the KDapp vs. variant (error bars represent the standard error of the mean, N = 3) (bottom). WT: wild-type. 1A: R261A/R293A. 2A: R216/K231A. 1A2A: R261A/R293A/R216A/K231A. iC3b: for comparison, the KDapp from a and c is also shown. All SPR experiments were conducted at least twice independently with similar results. Source data are provided as a Source Data file.

