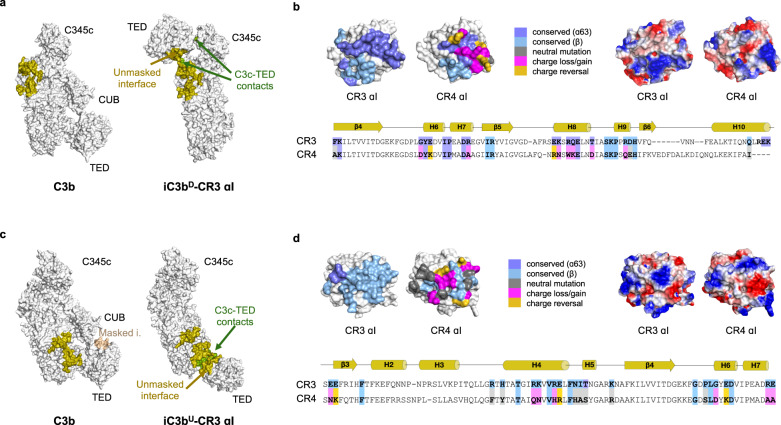
Fig. 8. Structural basis for iC3b selectivity toward integrin receptors.
a Molecular surface representations of C3b (PDB 2I07) and iC3bD roughly in the same orientation. CR3 αI has been removed from the complex with iC3bD to reveal the binding site. CR3 αI binding site is mapped onto the molecular surface of iC3bD in olive color. The same residues have been highlighted in C3b for comparison. Additionally, on iC3bD, the contact area between the C3c moiety and the TED in its final position is shown in green. iC3bD residues which were inaccessible to CR3 αI in C3b but have become exposed in iC3bD are denoted as unmasked interface. b Like a, comparison of C3b (PDB 2I07) and iC3bU. Residues on C3b that could not bind CR3 αI due to steric impediments or lack of rotational freedom are mapped in wheat color and denoted as masked i(nterface). Upon conversion to iC3bU, residues in the masked interface on C3b are mapped onto iC3bU as part of the unmasked interface. c Sequence variation and electrostatic properties of the αI domains of CR3 and CR4 at the contact interface with the C3c moiety of iC3b, shown as molecular surfaces in the same orientation. The view is perpendicular to the iC3bD–CR3 αI interface. Top left, sequence variation mapping. Residues that are not part of the interface are shown in white. Interfacial residues strictly conserved in CR4 αI are colored according to which chain of iC3bD they interact with: light blue (chain β); slate (chain α63). Residues not conserved are classified (and color-coded) according to: nonconservative substitutions without a change in net charge (gray); substitutions with loss or gain of net charge (magenta); charge reversal substitutions in either direction (gold). Top right, electrostatic potential mapped on the molecular surface, calculated with APBS44. Bottom, sequence alignment of mapped regions with identical color code. d Like c, view is perpendicular to the iC3bU–CR3 αI interface.

