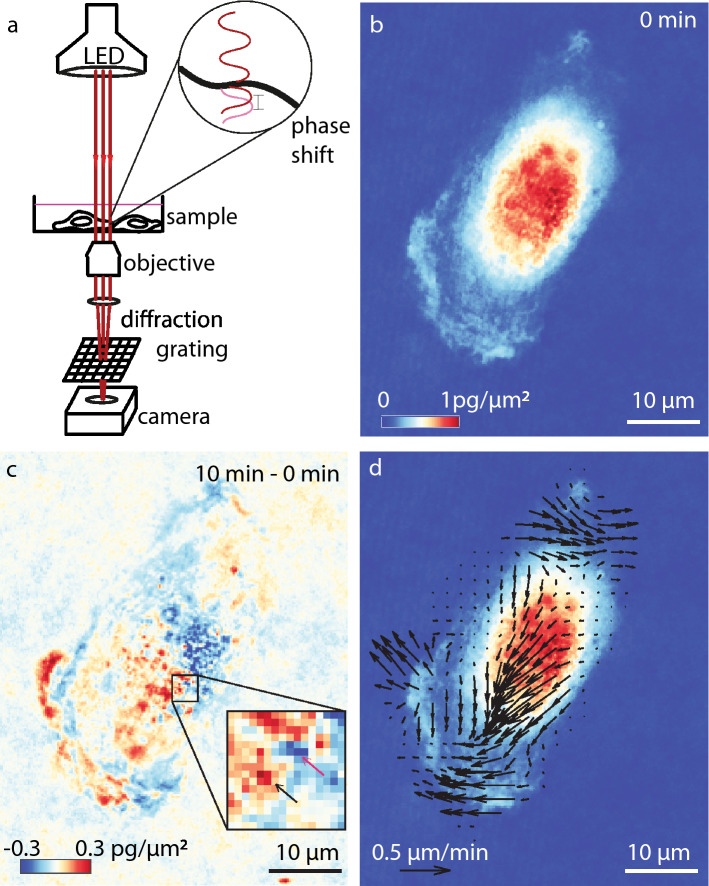
Figure 1.
Quantitative phase velocimetry (QPV) measures intracellular dry mass movement. (a) Quantitative phase imaging (QPI) measures the phase shift of light passing through a cell, which is used to compute the dry mass distribution in cells over time. (b) Dry mass distribution in RPE cell imaged at 120X magnification, at t = 0 min. The scalebar indicates 10 µm length. (c) The difference in QPI mass distribution of the RPE cell in (b) from an image taken at t = 10 min later minus the image at 0 min reveals cell motion. The inset in (c) shows a 15 × 15 pixel interrogation window that illustrates the change in position of an individual subcellular feature from the position marked with a red arrow to the position marked with a black arrow. The color scale shows dry mass difference between frame at time 0 and 10 min (red: large increase in mass, blue: large decrease in mass). (d) The resulting intracellular biomass velocity field computed using quantitative phase velocimetry (QPV). Velocity magnitude indicated with a 0.5 µm/min scalebar.

