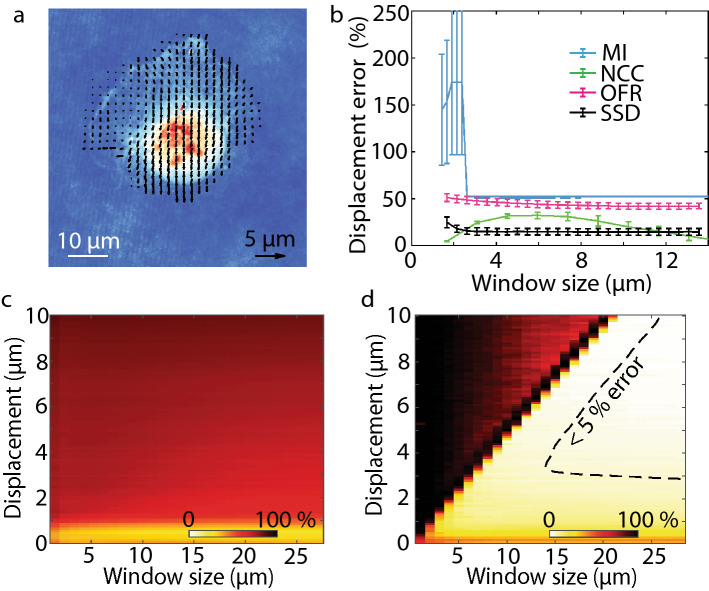
Figure 2.
SSD image registration measures intracellular velocity from QPI data with higher accuracy than OFR, MI and NCC at most interrogation window sizes. (a) QPV on RPE fixed cell measures the intracellular displacement during microscope stage translation. (b) Comparison of displacement error, the percentage difference between the measured and expected displacements, for mutual information (MI), normalized cross correlation (NCC), optical flow reconstruction (OFR) and sum of squared difference (SSD) for intracellular velocity computation on QPI data at different interrogation window sizes shows SSD has highest accuracy at most window sizes (number of cells, n, = 11, error bar shows standard error of the mean, SEM). (c) Velocity accuracy versus both interrogation window size and displacements of RPE fixed cell using OFR shows that OFR is limited to measuring a very narrow range of displacements with acceptable accuracy (n = 11). Yellow/white – high accuracy, red/black–low accuracy. (d) QPV velocity measurement accuracy versus interrogation window size and displacements of fixed RPE cells show typically less than 10% error when the interrogation window size is smaller than the displacement to be measured with a region of less than 5% error indicated as a dashed line (n = 11).

