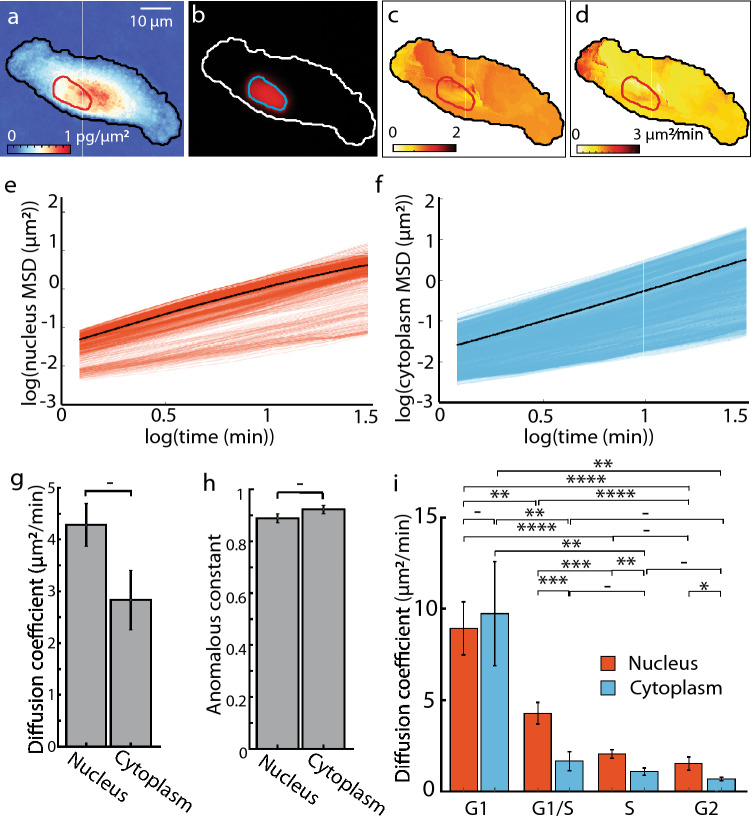
Figure 5.
Mean squared displacement (MSD) analysis shows reduced diffusion coefficient in RPE cells with cell cycle progression. (a) QPI image of individual RPE cell with red nuclear and black cytoplasmic boundary shown. (b) Anomalous constant distribution within the RPE cell from (a). (c) Diffusion coefficient distribution within the RPE cell from (a). (e) Logarithm of MSD vs time lag of nuclear volumes of the RPE cell in (a). The black line shows the mean of all nuclear volumes. (f) Logarithm of MSD vs time lag of intracellular cytoplasm volumes of RPE cells in (a). Black line shows the mean of all cytoplasmic volumes. (g) Separation of diffusion coefficient in nucleus and cytoplasm of the RPE live cells shows moderate, but not significant reduction in diffusion coefficient in the cytoplasm relative to the nucleus. (h) The anomalous constants from the MSD analysis on the same cells shows moderately sub-diffusive transport in both the nucleus and cytoplasm. (i) Nuclear and cytoplasmic diffusion coefficients in RPE cells over the cell cycle from n = 119 cells. Error bars show standard error of the mean. – p > 0.05 (not significant), **p < 0.01, ***p < 1 × 10⁻³, ****p < 1 × 10⁻⁴.

