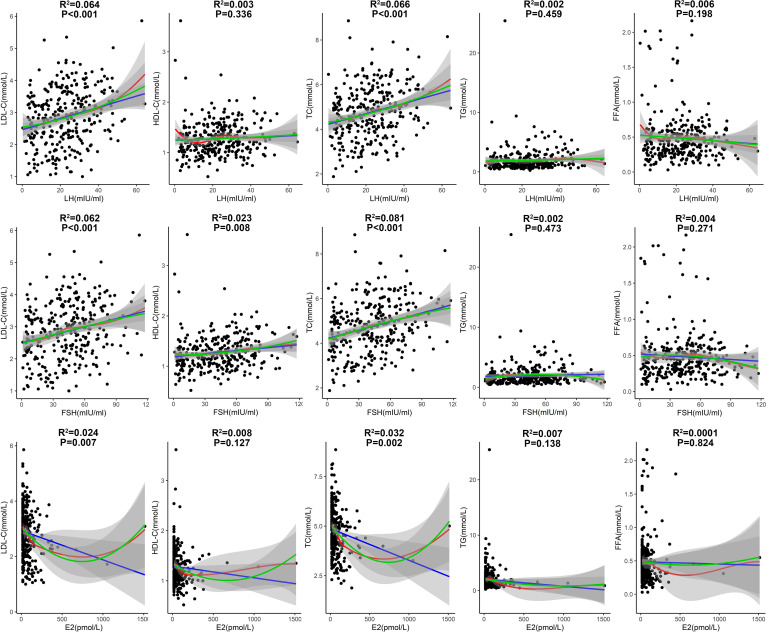
Figure 5.
Correlations of lipid profile with LH, FSH and E2 in patients with T2DM aged 51-60 years. (Fitted curves of linear model are shown in blue; smoothing fitted curves of LOESS model are in red; fitted curves of binary linear regression model are in green. Adjusted R2 and P values from the linear model are shown in the figure).

