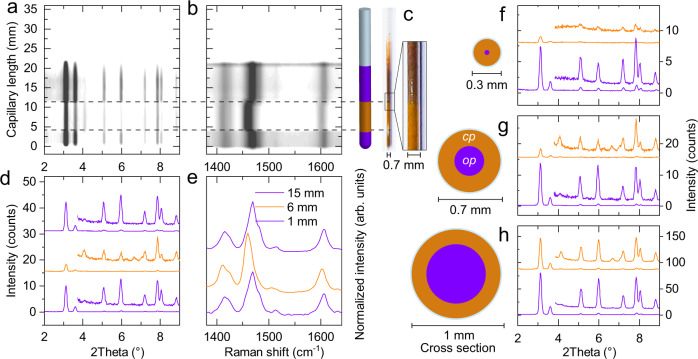
Fig. 5. Analysis of local photo-induced transition.
a–e Axial PXRD (a) and Raman scan (b) of a capillary with a diameter of 0.7 mm, image and illustration of the investigated capillary (c), selected PXRD patterns at 1 mm (bottom), 6 mm (middle), and 13 mm (top) (d), Raman spectra at selected positions (e), f–h PXRD patterns of non-irradiated and irradiated areas for capillaries with diameters of 0.3 mm (f), 0.7 mm (g), and 1 mm (h). Irradiated regions are marked in orange, non-irradiated areas in purple, inset enlarged patterns in f–h of 2Theta range 3.8-9° represent 20 times magnification.

