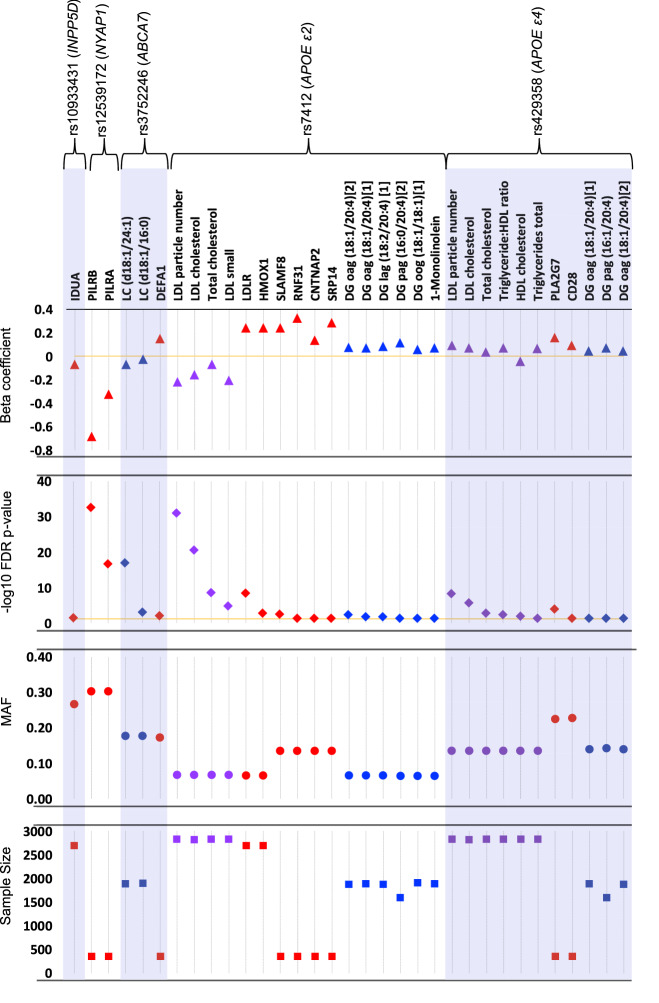
Figure 1.
Statistically significant SNP-analyte associations after correcting for multiple testing (threshold FDR-adjusted p-value = 0.05), by SNP. Top panel: log-transformed beta-coefficient from the linear regression model adjusted for sex, age, and genetic principal components 1–4; markers above the zero line (orange) indicate analytes that increased in value with the minor allele, while markers below the line indicate markers that decreased in value. Second panel: FDR-adjusted − log10 p-value; orange line at FDR-p = 0.05. Proteins = red, metabolites = blue, clinical chemistries = purple. Metabolite codes: DG diacylglycerol, LC lactosylceramide, o oleoyl; a arachidonoyl, g glycerol, l linoleoyl, p palmitoyl. Third panel: minor allele frequency (MAF). Bottom panel: Total sample size for each analyte-SNP regression.

