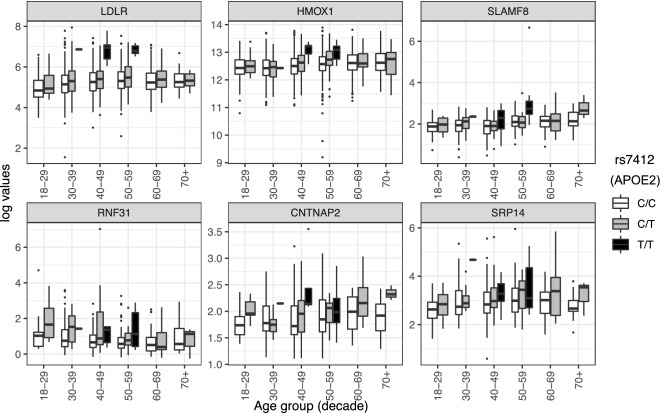
Figure 3.
Unadjusted box plots of normalized protein expression levels (NPX) of six proteins significantly associated with APOE2 genotype, by age group. White boxplots = individuals who are homozygous for the major allele, gray boxplots = heterozygotes, black boxplots = minor allele homozygotes. Box plot midline = median value, lower/upper hinges = 25th and 75th percentiles, respectively; lower whisker ends/upper whisker ends no further than 1.5× interquartile range from the hinge. Data beyond whiskers are outlying points. LDLR low-density lipoprotein receptor, HMOX1 heme oxygenase-1, SLAMF8 SLAM family member 8, RNF31 E3 ubiquitin-protein ligase RNF31, CNTNAP2 contactin-associated protein-like 2, SRP14 signal recognition particle 14 kDa protein.

