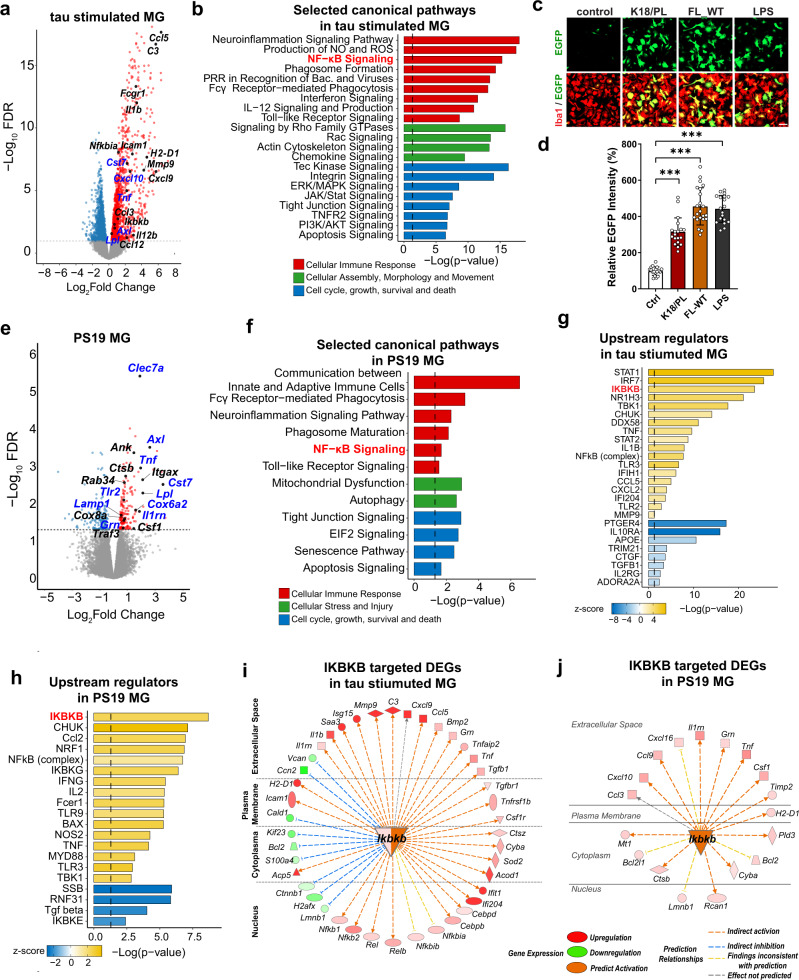
Fig. 1. Tau activates NF-κB pathway in microglia.
a Volcano plot of significant DEGs between full-length wild-type tau fibril-treated and vehicle-treated primary mouse microglia. Colored points represent FDR < 0.05 (−log (FDR) ≥ 1.3, dashed line), log2FC > 0 upregulated genes (red) and log2FC < 0 downregulated genes (blue). Selected NF-κB pathway associated genes and DAM signature genes are highlighted. FC fold change. b Selected IPA canonical pathways identified for significant DEGs of tau-stimulated microglia. Canonical pathways are grouped by indicated categories. c, d Primary microglia infected with NF-κB reporter (Lenti-κB-dEGFP) virus were incubated with K18/PL fibrils (2.5 ug/ml), full-length wild-type (FL-WT) tau fibrils (2 ug/ml), and LPS (50 ng/ml) for 24 h. c Representative fluorescence high-content images of EGFP (green) and microglial marker Iba1 (red); d Quantification of EGFP intensity. Scale bar, 50 μm. Values are mean ± SD, relative to vehicle control. Total N = 18(ctrl), 19(K18/PL), 22(FL-WT) and 19(LPS) wells from three independent experiments. P-value was calculated using multilevel mixed-effect model with experiment as hierarchical level, ***p < 0.001. Source data are provided as a Source data file. e Volcano plot of significant DEGs between isolated microglia from 11-month-old PS19 mice and non-transgenic controls. Selected NF-κB pathway associated genes and DAM signature genes are highlighted. f Selected IPA canonical pathways identified for significant DEGs in PS19 microglia. Canonical pathways are grouped by indicated categories. g, h Selected IPA predicted upstream regulators for DEGs of tau-stimulated microglia (g) and PS19 microglia (h). IKBKB (distinguished in red) is among the top upstream regulators. i, j The network of DEGs regulated by IKBKB in tau-stimulated microglia (i) and PS19 microglia (j). Locations, gene expression levels and predicted relationships with IKBKB are illustrated as indicated labels. Shades of red and green represent log2FC of selected DEGs. Genes highlighted in blue in a and e are selected DEGs upregulated in both tau-stimulated microglia and PS19 microglia. P-values of b, f, g, h were calculated using right-tailed Fisher’s exact test with threshold of significant enrichment as p-value ≤ 0.05 (indicated by a dotted line of −log (p-value) = 1.3).

