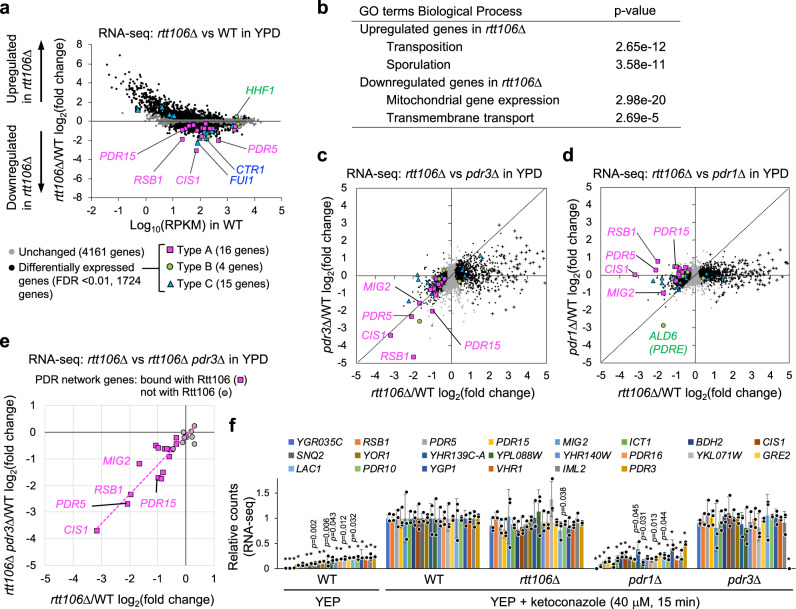
Fig. 3. Rtt106 is essential for Pdr3-mediated basal expression of the PDR network genes.
a RNA-seq analysis of rtt106Δ versus WT grown in YPD. Read counts of transcripts in rtt106Δ divided by those in WT were plotted against RPKM (reads per kilobase of transcript per million mapped reads) in WT. Data shows mean of three biological replicates. Among 1724 differentially expressed genes (black circles, FDR < 0.01), genes in Type A (magenta squares), Type B (green circles) and Type C (blue triangles) as defined in Fig. 2 are highlighted. b Gene Ontology (biological process) analysis of upregulated genes (588 genes, FDR < 0.0001) and downregulated genes (266 genes, FDR < 0.0001) in rtt106Δ, compared to WT, in YPD. P-values were calculated by a hypergeometric distribution with Bonferroni Correction in GO Term Finder. c Correlation of changes in mRNA level of each gene in pdr3Δ with those in rtt106Δ grown in YPD. Colour coding as in panel a. Genes with low expression level in WT (RPKM < 1) are marked by +. d Comparison of changes in mRNA level of each gene in pdr1Δ with those in rtt106Δ grown in YPD. Colour cording used in panel a is used. Genes with low expression level in WT (RPKM < 1) are marked by +. e Correlation of changes in mRNA levels of the PDR network genes in pdr3Δ rtt106Δ with those in rtt106Δ grown in YPD. PDR network genes with promoters bound by Rtt106 are shown by magenta squares, and those not bound by Rtt106 by grey circles. f Normalised read counts of transcripts of the PDR network genes relative to those in WT treated transiently by ketoconazole in YEP. The 22 PDR network genes whose transcripts increased more than 4-fold by ketoconazole treatment in WT are shown. Data are presented as mean values ± SD. Statistical significance determined by one-way ANOVA with post-hoc Tukey HSD tests, compared to WT treated with ketoconazole. *p = 0.001. c–f Data shows mean of three biological replicates.

