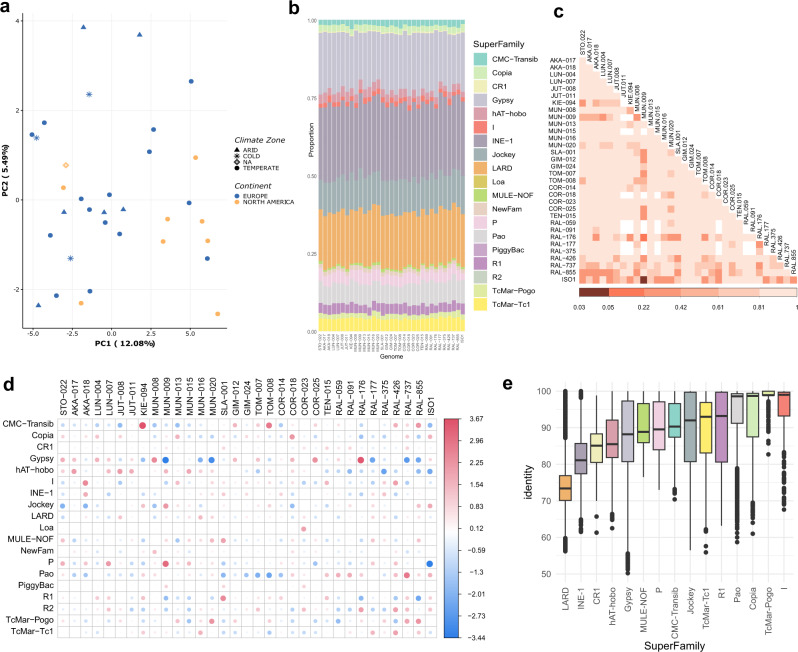
Fig. 4. TE annotations at the superfamily level.
a Principal component analysis based on TE insertions polymorphisms grouped by continent (colors) and climatic zoned (shapes). b The proportion of TE copies annotated for each superfamily. c Per genome pairwise comparisons in the proportion of copies annotated at the superfamily level. The colors of the matrix squares represent adjusted (FDR) p-values of the two-sided Chi Square test. Only one significant result was observed (adjusted p-value = 0.03) between ISO1 and MUN-009. d Representation of the Pearson residuals (r) for each cell (pair Superfamily-genome). Cells with the highest residuals contribute the most to the total Chi Square score. Positive values in cells (red) represent more copies than the expected, while negative residuals (blue) represent fewer copies than the expected (does not imply statistical significance). e Distribution of TE insertion identity values classified by superfamily and considering all genomes together. The boxplot shows median (the horizontal line in the box), 1st and 3rd quartiles (lower and upper bounds of box, respectively), minimum and maximum (lower and upper whiskers, respectively). Number of copies analyzed per superfamily are given in Supplementary Data 9c.

