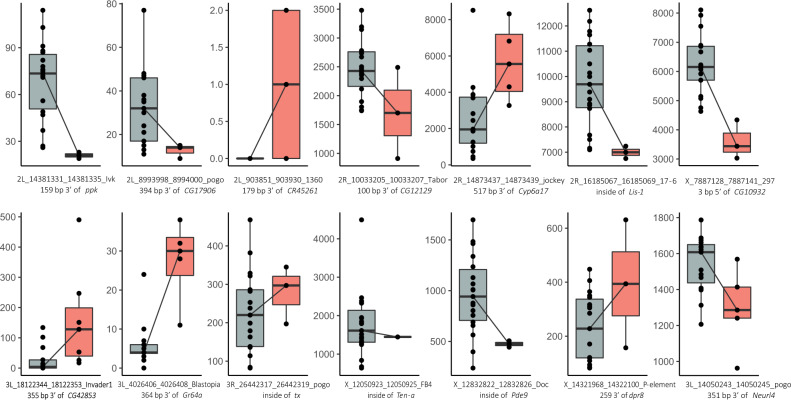
Fig. 6. Gene expression levels in strains with and without TE insertions.
Gene expression levels in strains without (gray) and with (red) the 13 TE insertions with the most significant association according to our eQTL analysis, and for the 3L_14050243_14050245_pogo insertion with evidence of selection (last plot). The name of the TE insertions and the genomic location regarding the associated gene is provided. In total, the expression levels of 20 strains are plotted. The boxplot shows median (the horizontal line in the box), 1st and 3rd quartiles (lower and upper bounds of box, respectively), minimum and maximum (lower and upper whiskers, respectively).

