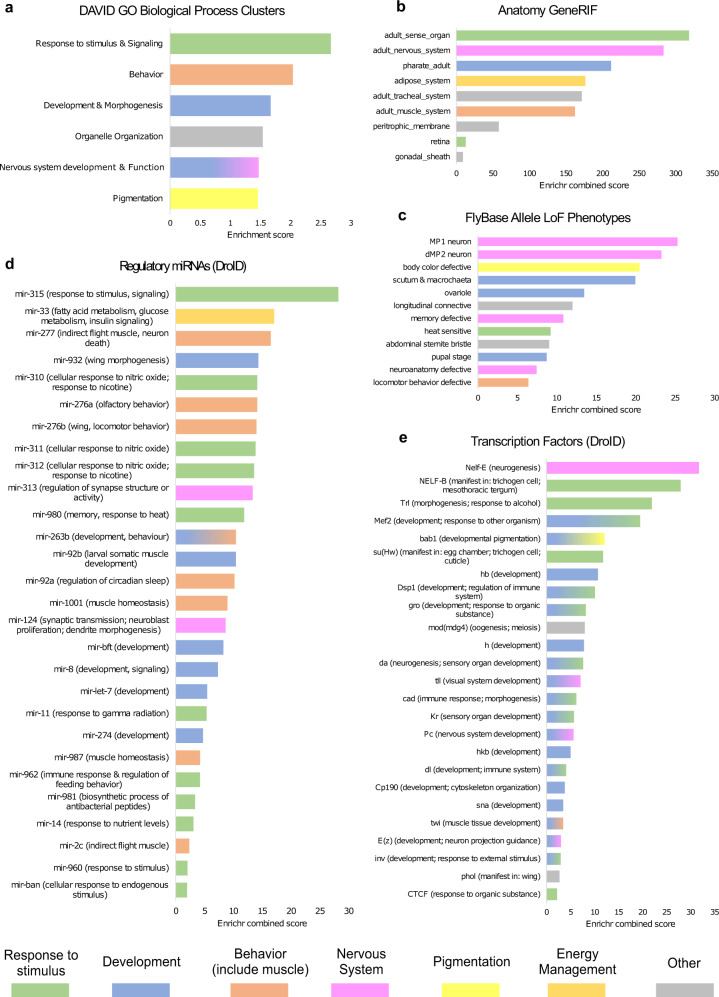
Fig. 7. Significantly enriched terms for genes nearby 107 TEs showing evidence of selection.
Each panel shows significant enriched terms using different approaches. a DAVID GO Biological Process: Horizontal axis represents DAVID enrichment score. Only significant (score > 1.3) and non-redundant clusters are shown. FlyEnrichr results when using different libraries: b Anatomy GeneRIF Predicted, c Allele LoF Phenotypes from FlyBase, d Putative Regulatory miRNAs from DroID and e Transcription Factors from DroID. Only statistically significant terms are shown (Fisher test (two sided) adjusted p-value <0.05). Horizontal axis represents the Enrichr Combined Score. For Regulatory miRNAs and Transcription Factors, putative biological functions or phenotypes associated were assigned based on FlyBase gene summaries. Bar colors indicate similar biological functions as specified at the bottom of the figure.

