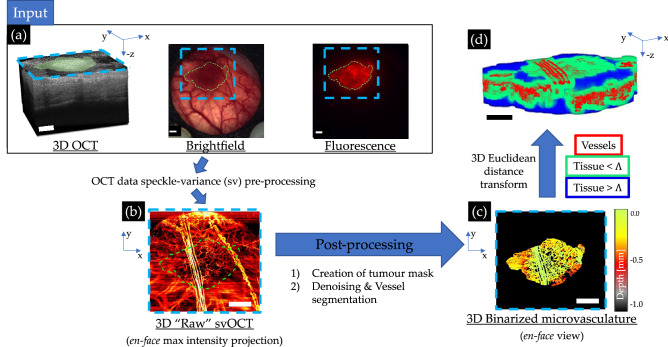
Figure 1.
svOCT microvascular segmentation pipeline to enable extraction of diffusion limited fraction and the vascular convexity index : (a) 3D structural OCT image along with corresponding brightfield and DsRed fluorescence micrographs; blue contours indicate the FOV of the corresponding OCT scan, green contours the tumour in the lateral plane; (b) en-face 2D maximum intensity projection of the resultant microvasculature obtained via svOCT processing using Eq. (1); (c) depth-encoded en-face projection of the binarized microvasculature in the segmented tumour VOI; (d) Colour-coded 3D representation of distance transformed binarized svOCT volume delineating vessels (red), as well as both proximal ( μm, green) and distant ( μm, blue) tissue voxels from the nearest vessel. This final image enables all computations pertaining to the distance to nearest vessel (DNV) histograms (for details, see text, Sect. Tissue microvasculature heterogeneity quantification). Scale bars are mm, 3D volumes are mm3 (). All images above are derived from the same mouse-timepoint data acquisition. Green lateral tumour contours were generated based on the raw brightfield and fluorescence images (shown above) using MATLAB R2021a software. OCT-derived images were generated by processing the same raw OCT acquisition using custom scripts in MATLAB R2021a software (https://github.com/nallam1/Batch-processing-multimodality-tumour-imaging). Organization of the images for display was completed in Microsoft PowerPoint.

