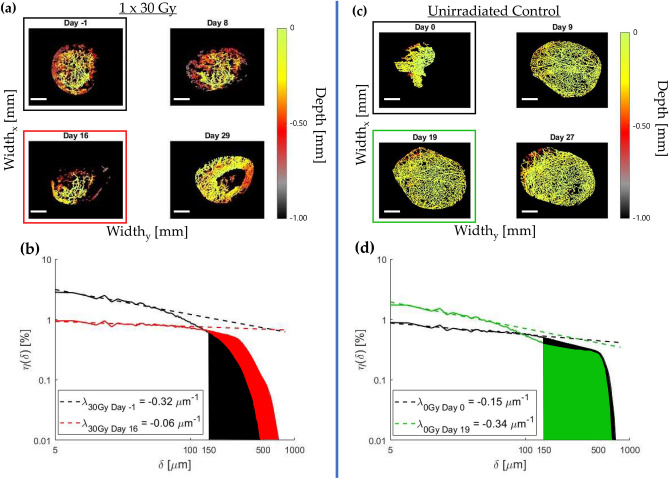
Figure 3.
Illustrative changes in vascular architectures for irradiated and un-irradiated tumours, with corresponding and quantification: (a) Gy irradiated and (c) unirradiated control colour-depth encoded binarized vasculature within the tumour VOI for several timepoints over the course of a month; (b) and (d) show the corresponding and weeks DNV histograms for both mice, and the two derived metrics. The slope of the histogram at short distances (defining the convexity index ) generally increased after irradiation at this time (b), while the opposite was seen in unirradiated controls (d). For “avascular” regions as quantified by , the trends were a general initial increase in with dose (b), while it slightly decreased in the absence of irradiation (d). More comprehensive time-dose summary for all animals is presented in Fig. 4. Scale bars are mm.

