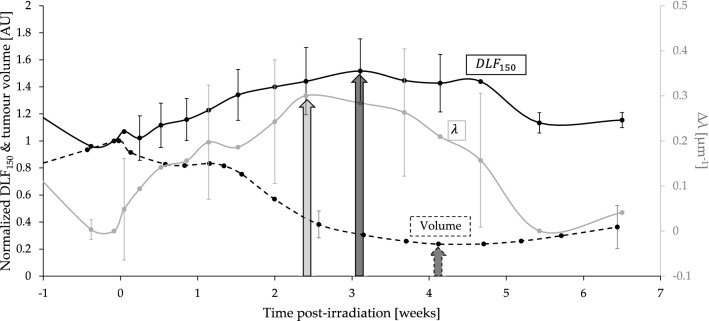
Figure 6.
& metrics show consistent and earlier trends compared with the tumour volume response, showing promise as candidate predictive biomarkers. The mean normalized (solid black, left y-axis) and λ (solid grey, right y-axis) for the Gy treated mice seem to precede the temporal evolution of the mean normalized tumour volume (dotted black, left y-axis). Arrows represent approximate time-to-peak in response maxima and minima, respectively. Error bars represent standard deviations.

