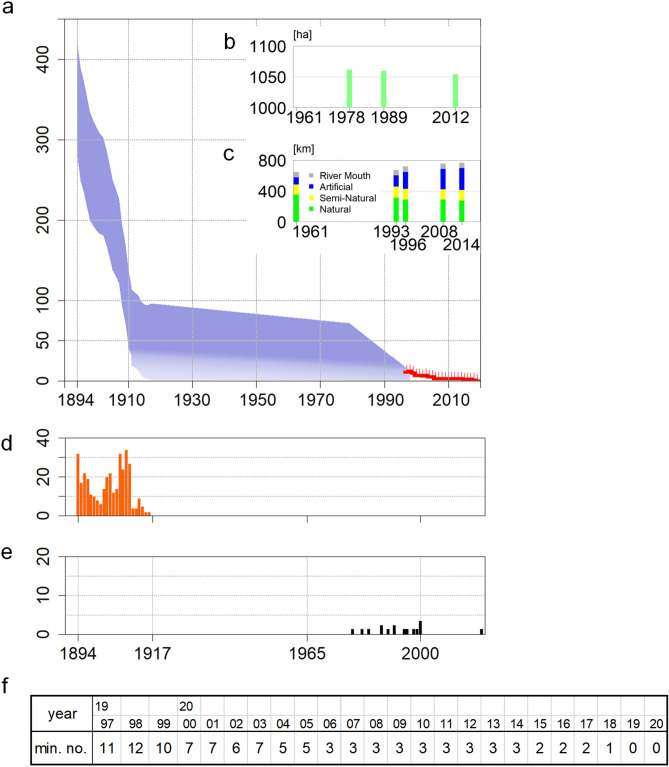
Figure 2.
Time-series changes in the number of individual dugongs from 1894 to 2020. (a) The estimated number of dugongs in coastal waters near the Ryukyu Islands. (b) Change in the area of seagrass around Okinawa Island (Extended Data Fig. 2). (c) Lengths of natural (green), semi-natural (yellow), and artificial (blue) coastlines around Okinawa Island in 1961, 1993, 1996, 2008, and 2014 (Extended Data Fig. 3). (d) Number of dugongs captured per year from 1894 to 1916 (Extended Data Fig. 1) (refs.14,15). (e) Records of dugong stranding or caught as bycatch since 1979. (f) Minimum number of dugongs identified by aerial observation and bycatch/stranding records since 1997 (Supplementary Data).

