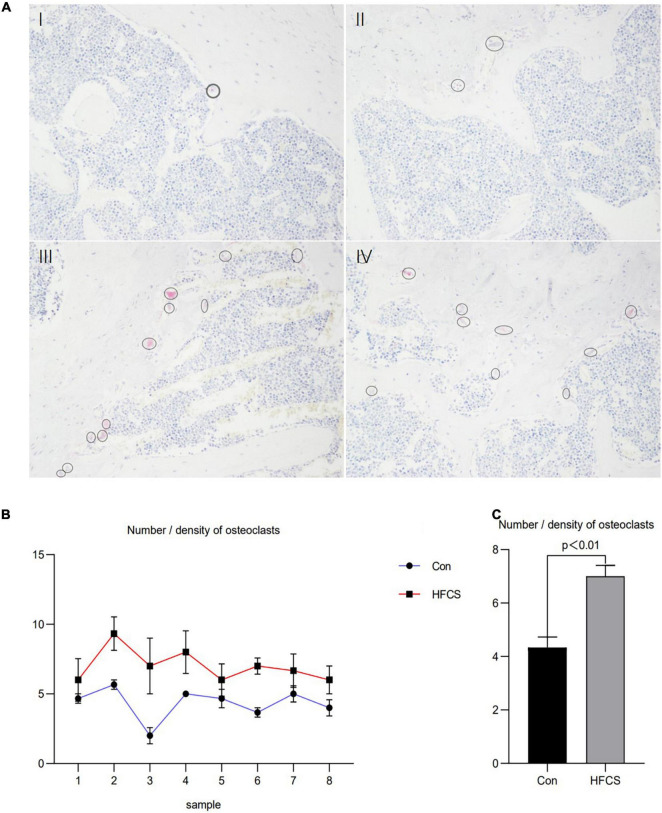
FIGURE 2.
Effect of HFCS on the number and density of osteoclasts in male mice. Results of TRAP staining of mouse femurs showing in (A), control (I, II) and HFCS (III, IV) groups. Image magnification 200 times, the circles and ellipses showing are osteoclasts. Plot of the number/density of osteoclasts in the femurs of the eight mice (B). The average number/density of osteoclasts in the femurs of mice (C). Data was expressed as mean ± SEM (n = 8) and analyzed by one-way ANOVA analysis.

