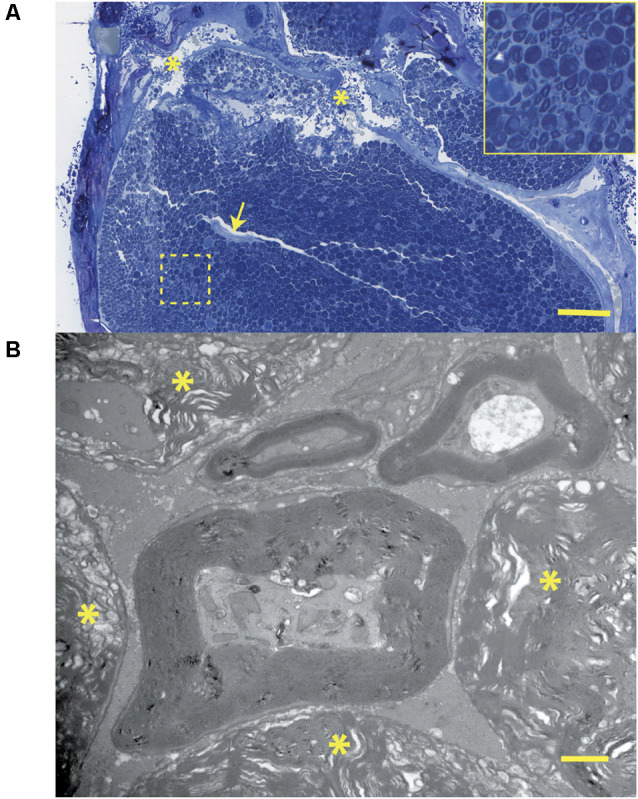
Figure 11.

(A) Histology corresponding to the CMAP tracing of Figure 7: this transverse section through the crush zone shows the majority of myelinated axons are damaged. There are breaks in the perineurium (asterisks), a collapsed artery (arrow), and some superficial regions (near the periphery) containing small fibers that appear spared. The insert shows several axonal profiles that are non-myelinated. The two fascicles at the top supply the gastrocnemius muscle. Bar = 100 μm. (B) At the ultrastructural level, from the same tissue specimen shown in Figure 6A; the details of nerve fiber breakdown, progressing from small to large, are seen. Note that small fibers may appear “normal” and that axoplasmic changes precede those involving the myelin sheath. The non-myelinated axons (top) also appear normal. The many myelin figures (*) at the periphery all appear most advanced. Bar = 1 μm, insert is an enlargement of the dotted line region.
