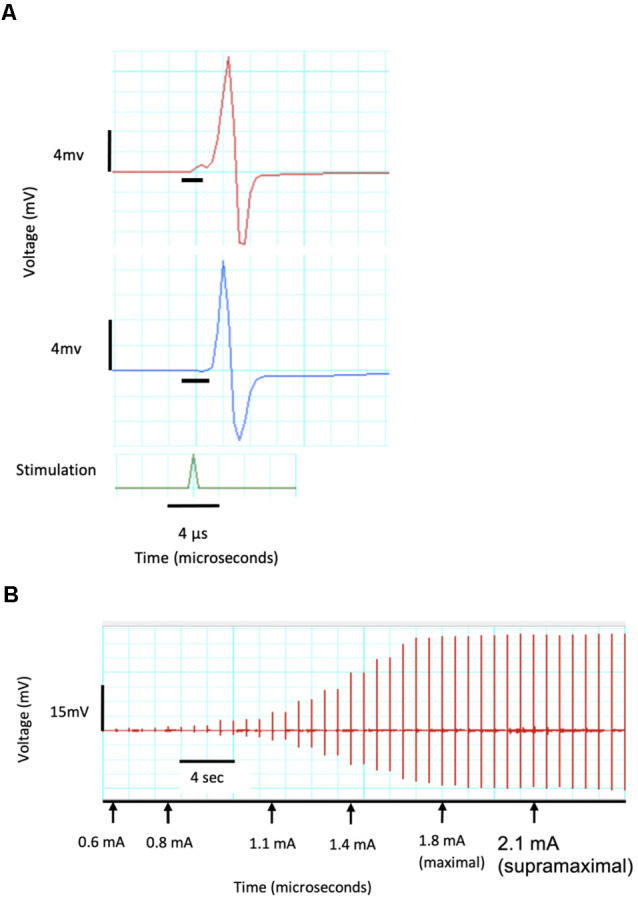
Figure 3.

CMAP recordings demonstrating a current response test from a single channel. (A) Recording of two CMAPs with peaks of 8.5 and 11 mV as well as a delay of 0.03 and 0.02 μs which are identified by the black horizontal crossbars. (B) Current response curve showing threshold CMAP at a stimulating current of 0.6 mA, maximal response at 1.8 mA and 120% maximal (supramaximal) response at 2.1 mA and used in all further CMAP tests.
