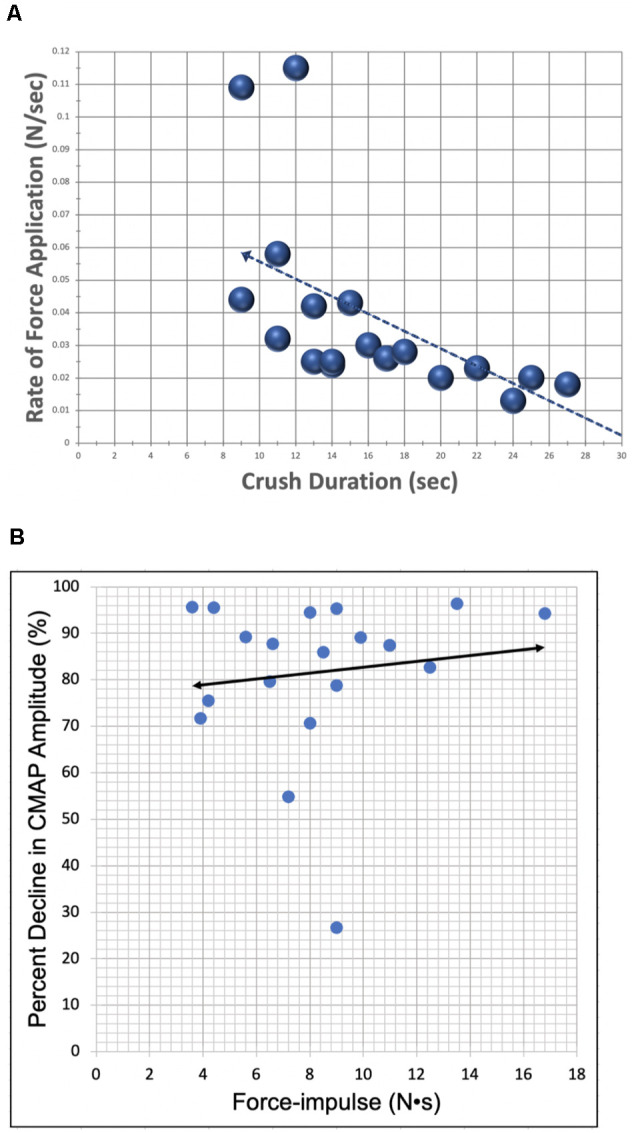
Figure 6.

Scatter plots demonstrating correlation between lesion parameters. (A) The relationship between the rate of force application (y-axis) and crush duration (x-axis) for all crush trials (N = 19). Correlation (r = −0.609) was found to be statistically significant with a p-value = 0.006. (B) The relationship between percent decrease in CMAP amplitude (y-axis) and applied F-i (x-axis) for all crush trials (N = 19). Bivariate correlation between variables was found to be statistically insignificant, likely due to the relatively low power of this study.
