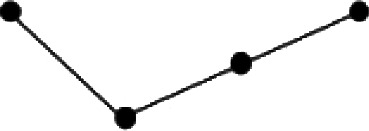
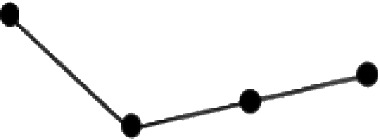
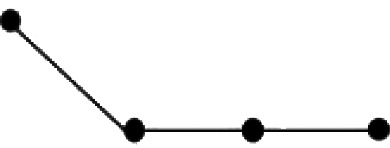
Table 3.
Different trajectories of combinations of all COVID-19 symptoms and function domains.
| Trajectory % (n) | COVID-19 symptoms combined | Function domains combined | All five COVID-19 symptoms and all three function domains | |
|---|---|---|---|---|
No decline 
|
10.5% (9) | 30.2% (26) | 9.3% (8) | |
| Decline | Total recovery 
|
36.0% (31) | 36% (31) | 30.2% (26) |
Partial recovery 
|
46.5% (40) | 29.1% (25) | 55.8% (48) | |
No recovery 
|
7% (6) | 4.7% (4) | 4.7% (4) |
