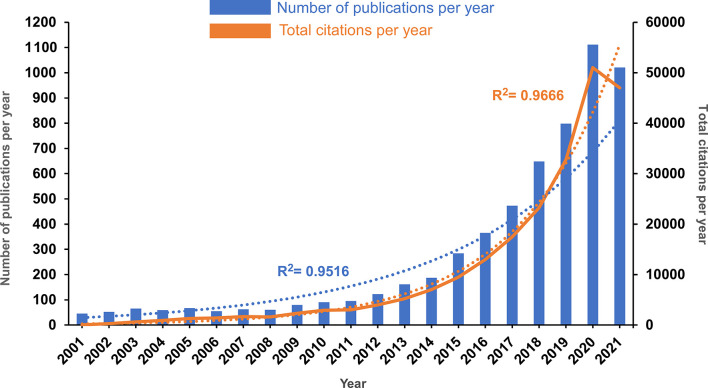
Figure 1.
The annual publication and annual citation trends in the past 20 years. The blue bars represent the number of publications per year, and the orange solid curve represents the total number of citations per year. The blue and orange dotted lines represent the trend-fitted curves using exponential functions. The correlation coefficients (R2) are displayed in the figure.

