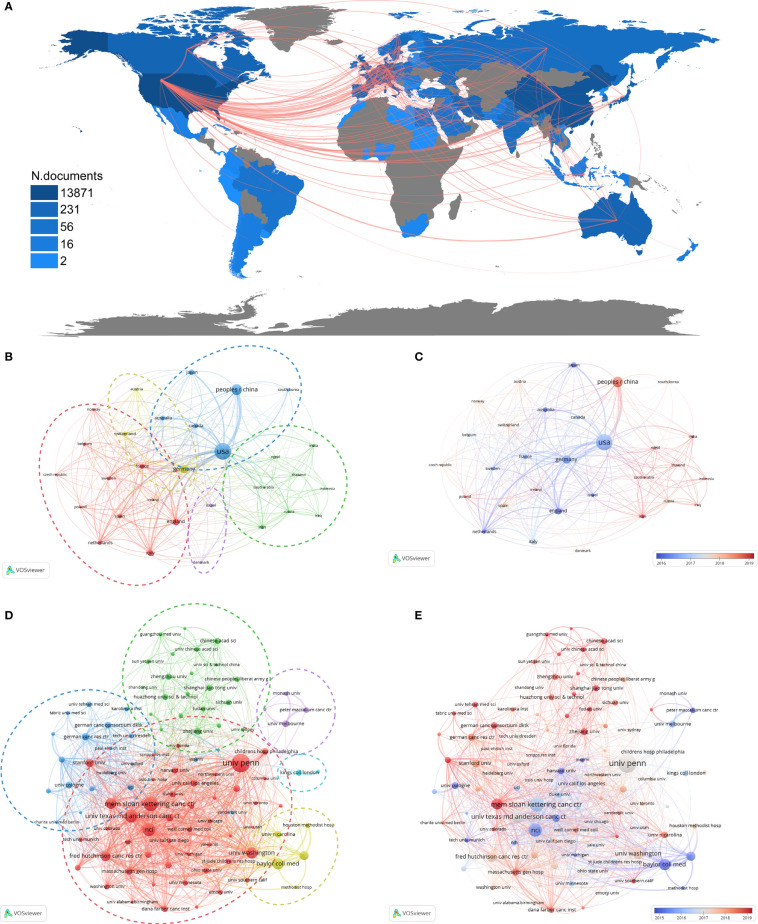
Figure 3.
Collaboration networks among countries and among institutions. (A) The collaboration map among countries. Color shades represent the number of publications in each country, and red lines indicate cooperation between two countries. Each node in (B–E) represents a country or an institution, and each line represents a link between two countries or institutions. The dotted circles in different colors in (B, D) indicate the corresponding clusters of countries and institutions. (B) The cooperation network among the top 30 most productive countries. (C) The time-overlay map of the cooperation network among the top 30 most productive countries. (D) The cooperation network among the top 100 most productive institutions. (E) The time-overlay map of the cooperation network among the top 100 most productive institutions.

