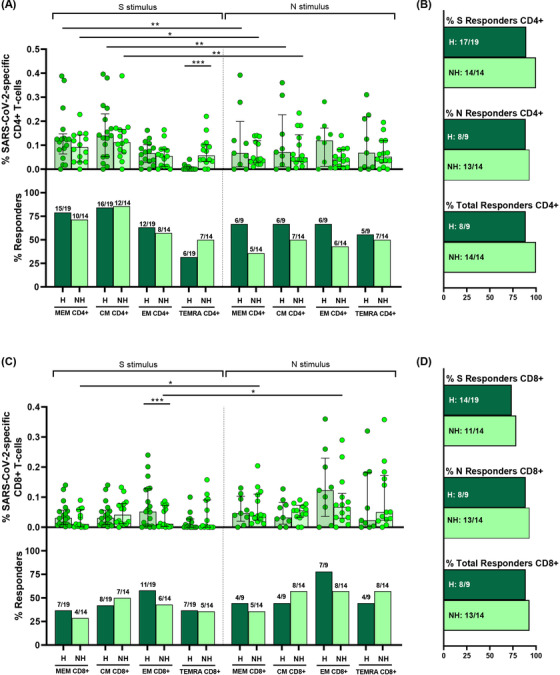
FIGURE 5.

S and N specific CD4+ and CD8+ T‐cell response are present in previously hospitalised (H) and non‐hospitalised (NH) patients 7 months after SARS‐CoV‐2 infection. (A,C) Bar graphs represent percentage of S and N specific CD4+ and CD8+ T‐cell response in previously hospitalised (H) (dark green) and non‐hospitalised (NH) (light green) subjects (top panels). Bar graphs also show the number and percentage of responders, considering a responder subjects as those with the percentage of SARS‐CoV‐2‐specific T‐cells higher than 0.05% considering the sum of IFN‐γ, TNF‐α and IL‐2 production (bottom panels). (B,D) Bar graphs describe the number and percentage of responders for S peptide pool, as the sum of any CD3+CD4+ or CD3+CD8+ T‐cell subset (% S responders); for N peptide pool, as the sum of any CD3+CD4+ or CD3+CD8+ T‐cell subset (% N responders) and the total responders as the sum of CD3+CD4+ or CD3+CD8+ S and N responses (% of total responders). The medians with the interquartile ranges are shown. Each dot represents an individual. ROUT method was utilised to identify and discard outliers. *p < 0.05, **p < 0.01, ***p < 0.001, ****p < 0.0001. Mann–Whitney U‐test was used for groups’ comparisons. Categorical variables were compared using the χ2 test or the Fisher's exact test. (H, n = 19; NH, n = 14)
