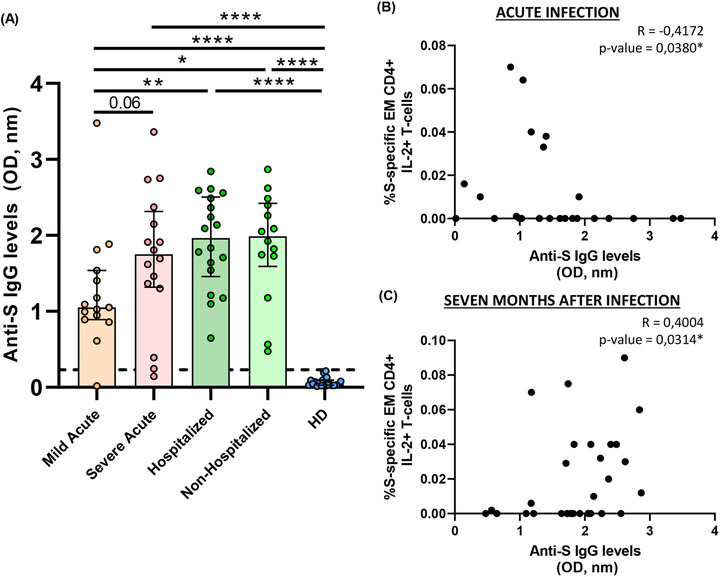
FIGURE 7.

Anti‐S IgG levels are associated with COVID‐19 severity and correlate with S‐specific T‐cell response. (A) Bar graphs represent anti‐S IgG levels in each study group. The dotted line indicates the cut‐off value (0.23 OD, nm). (B) Correlation graphs between anti‐S IgG levels and the percentage of S‐specific EM CD4+ IL‐2+ T‐cell response in acute infection. (C) Correlation graphs between anti‐S IgG levels and the percentage of S‐specific EM CD4+ IL‐2+ T‐cell response previously hospitalised patients 7 months after SARS‐CoV‐2 infection. Plasma sample was used at 1:100 dilution. Each dot represents an individual. ROUT method was utilised to identify and discard outliers. *p < 0.05, **p < 0.01, ***p < 0.001, ****p < 0.0001. Mann–Whitney U‐test was used for groups’ comparisons and Spearman test for non‐parametric correlations. (Mild acute, n = 15; severe acute, n = 16; hospitalised, n = 18; non‐hospitalised, n = 14, HD, n = 21)
