
FIGURE 1.
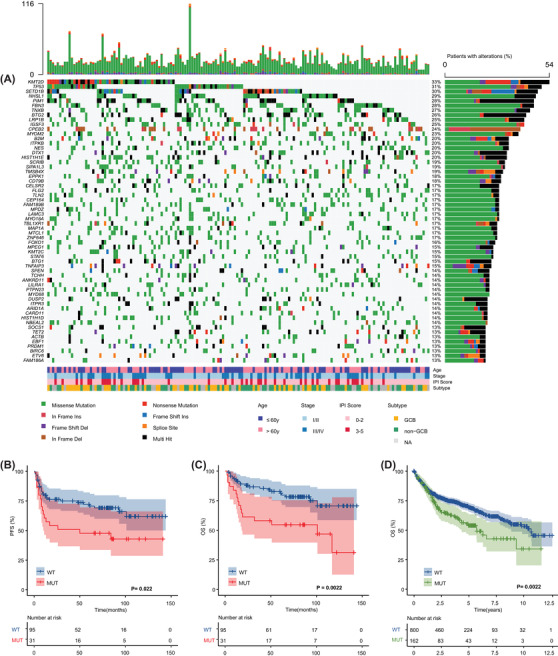
Genomic landscape and survival according to PIM1 status in 162 diffuse large B‐cell lymphoma (DLBCL) patients. (A) The mutational heat map of top 60 high‐frequency mutation genes in 162 patients. Each row represents one gene and each column represents one patient. The bar at top represents the number of mutations a patient has. The vertical plot on the right depicts the number of mutations in each gene. Each mutation type is color coded as indicated by the legend. Clinical features, including age, stage, International Prognostic Index (IPI) score and GCB versus non‐GCB DLBCL subtype were provided. (B) The Kaplan–Meier survival curves of PFS for mutant and wild‐type PIM1 patients (p = .022). (C) The Kaplan–Meier survival curves of overall survival (OS) for mutant and wild‐type PIM1 patients (p = .0022). (D) The Kaplan–Meier survival curves of OS for mutant and wild‐type PIM1 patients from publicly available data (p = .0022; accession number EGA: EGAS00001002606)