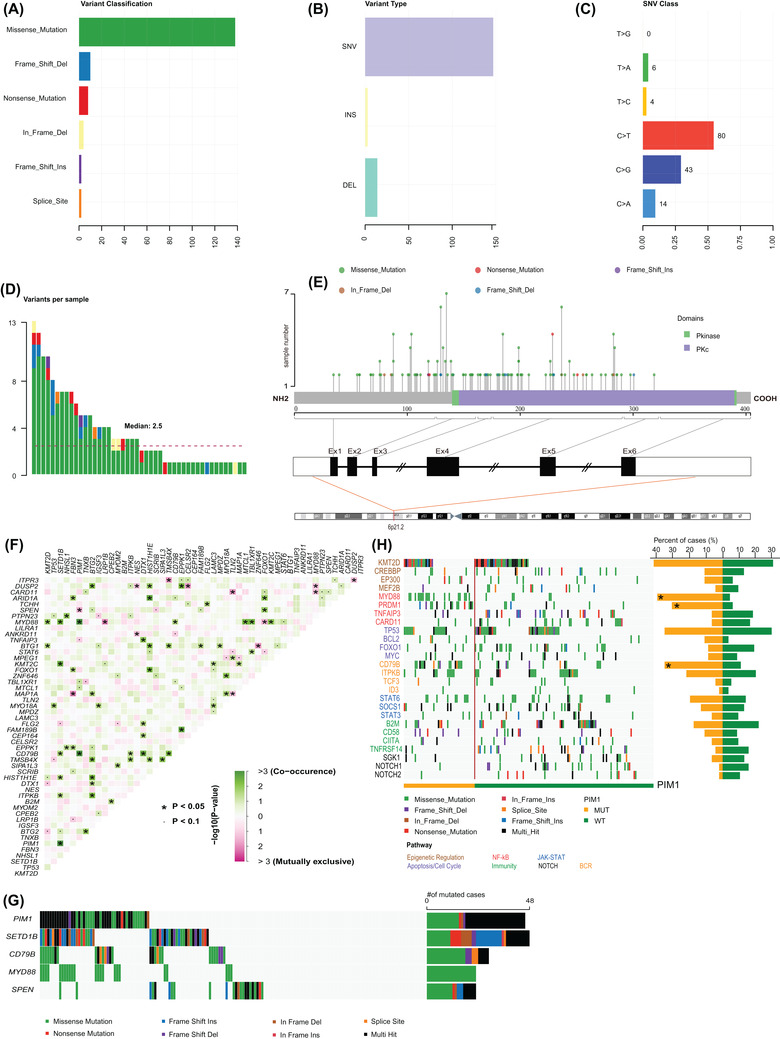
FIGURE 2.

PIM1 variants, structure, and interaction analysis of mutations. (A) The number of PIM1 variant classifications detected. (B) Counts of PIM1 variant types detected. (C) Summary of PIM1 base substitutions. (D) Variants of PIM1 per mutant patient. (E) Schematic representation of the domain structure and locations of the somatic mutations within PIM1 observed. The lines represent the position of the mutations. (F) Co‐mutational and mutually exclusive patterns in gene pairs based on the top 50 most frequently mutated genes. The green squares represent co‐occurring mutations, and pink represent mutually exclusive mutations. The intensity of the color is correspondent to the ‐log10 (p‐value). (G) Significant examples of co‐occurring mutations (PIM1 and SETD1B, PIM1 and CD79B) and mutual exclusivity (PIM1 and SPEN). (H) Overview of the distinct profiles of mutant PIM1 and wild‐type PIM1 diffuse large B‐cell lymphoma (DLBCL). Each column represents one sample, and each line represents one gene. Genes (in rows) are grouped according to their involvement in the signalling pathway with a color code and ordered according to their mutation frequencies within each group
