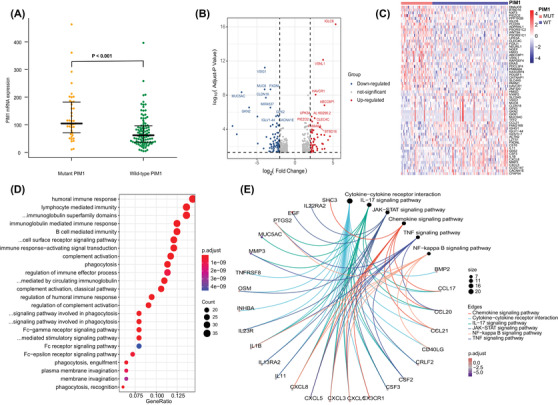
FIGURE 3.

Biological function analysis mediated by mutant PIM1 (MUT‐PIM1) compared to wild‐type PIM1 (WT‐PIM1). (A) Comparison of PIM1 gene expression between MUT‐PIM1 and WT‐PIM1. (B) Volcano plot and (C) heat map (top 30 upregulated and top 30 downregulated genes with fold change ≥1.0 and p < .05) revealed different gene expression patterns between the MUT‐PIM1 and WT‐PIM1 groups. (D) GO plots of the differentially expressed genes (DEGs). (E) KEGG analysis results of the DEGs
